AI agents need a marketing data model and a semantic layer
Scott Zakrajsek, 23 min read.
- published
- updated
- last verified
- category
- Data Foundations
- tags
- semantic-layer, ai-agents, mcp, guardrails
- format
- Paper, long-form
- built on by
- The Semantic Layer, Explained for Marketers (planned)The Marketing Data Stack in 2026: What to Own and What to Rent (planned)From Warehouse to Context Layer: What a Knowledge Graph Adds for Agents (planned)Data Coverage Scoring: Grading How Ready Each Brand Is for AI (planned)Identity Resolution for AI-Era Marketing: Building a Customer Spine (planned)Data Quality Monitoring When Agents Act on the Numbers (planned)Why Meta, GA4, and Shopify report three numbers for the same week (planned)
Key takeaways
- Accuracy comes first. An AI agent reporting your numbers has to be as careful as the people checking them now.
- On raw tables, an agent guesses. It infers joins and revenue from column names; on real warehouse sprawl the best system scored 6.8%.
- Build the marketing data model finer than your reporting. Tested marketing, customer, product, and order tables, plus calendars, let an agent find trends and forecast.
- Define each metric once, your way. Name every version of revenue, set a default, and make your churn and lifetime value definitions the standard.
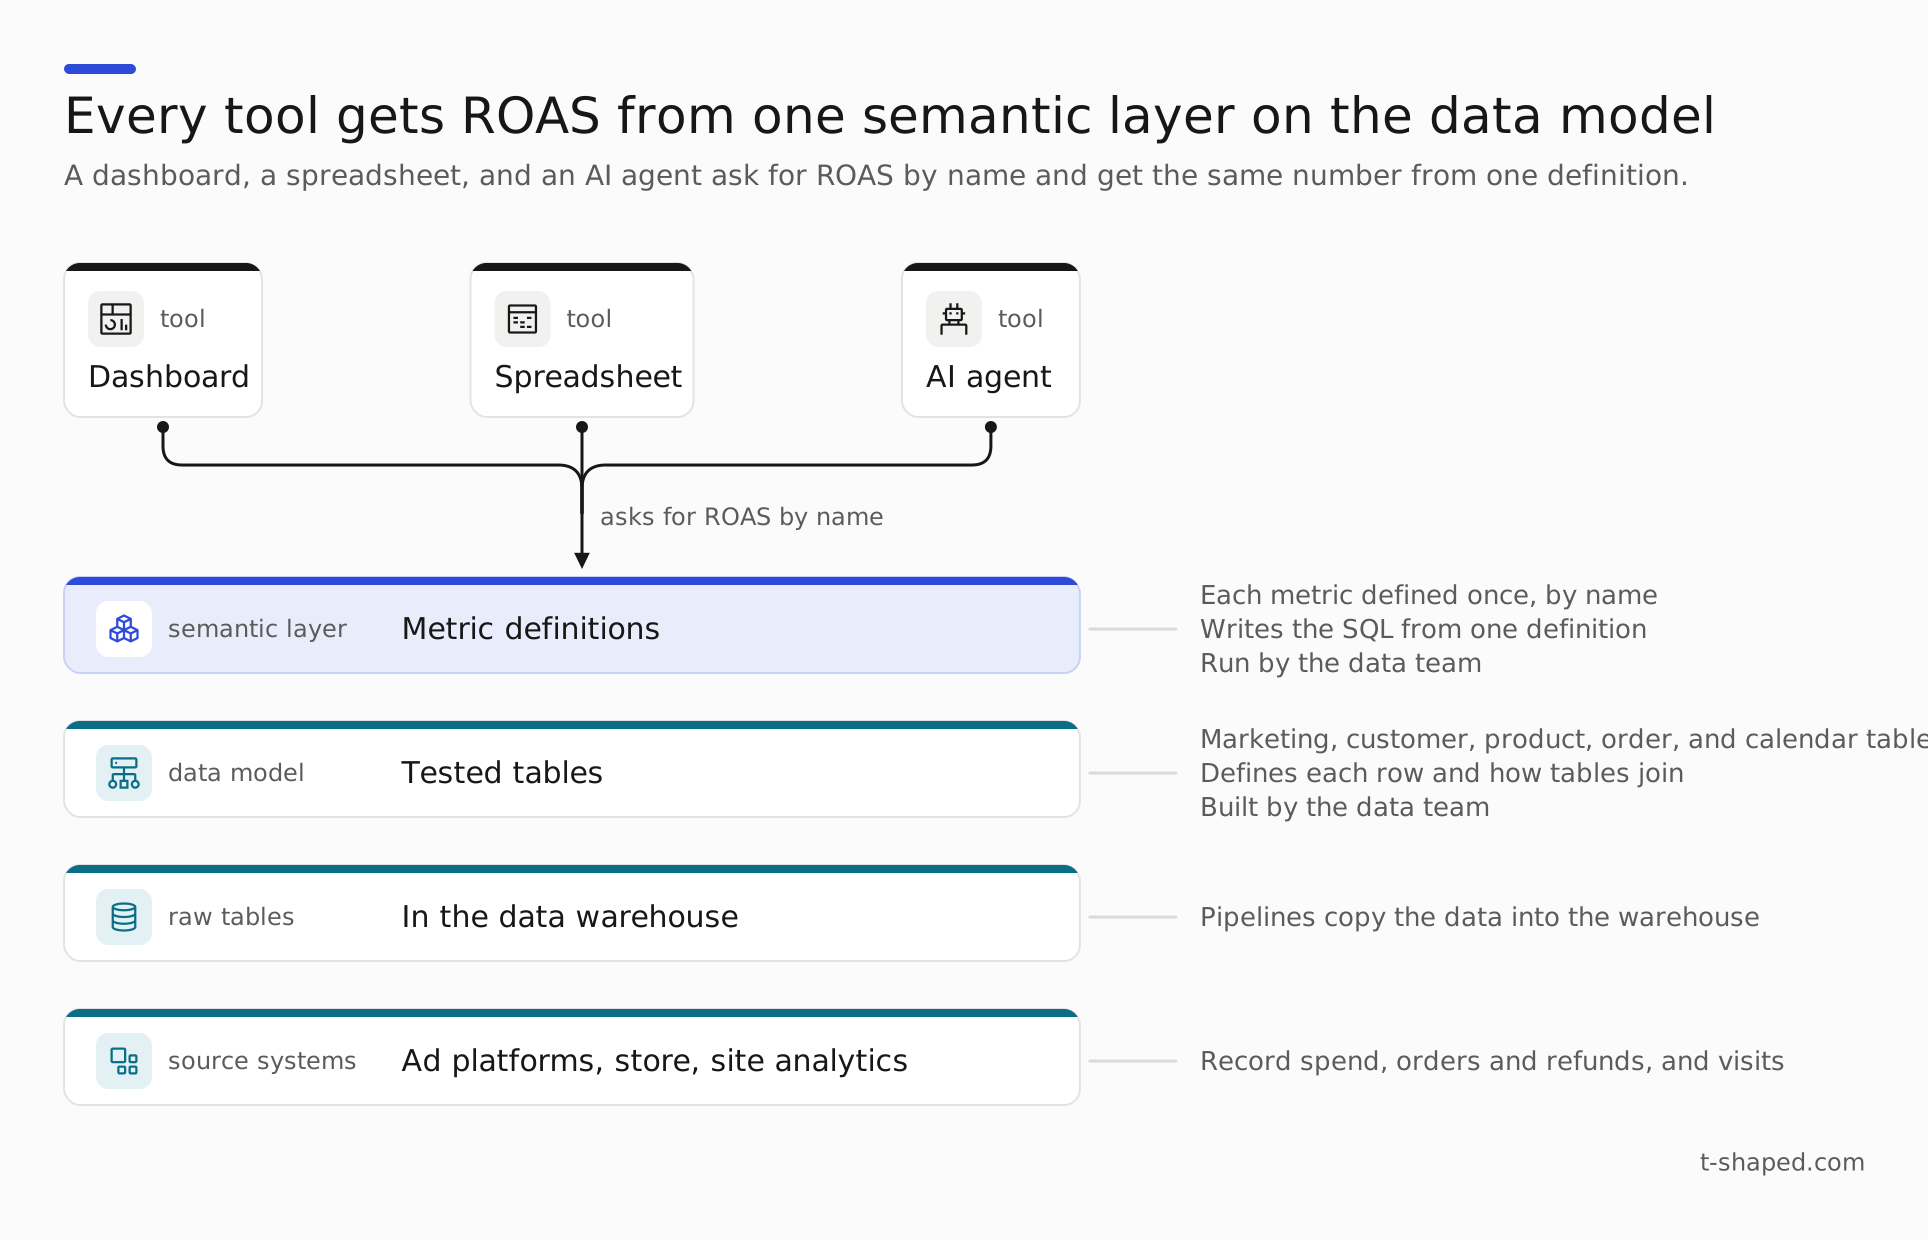
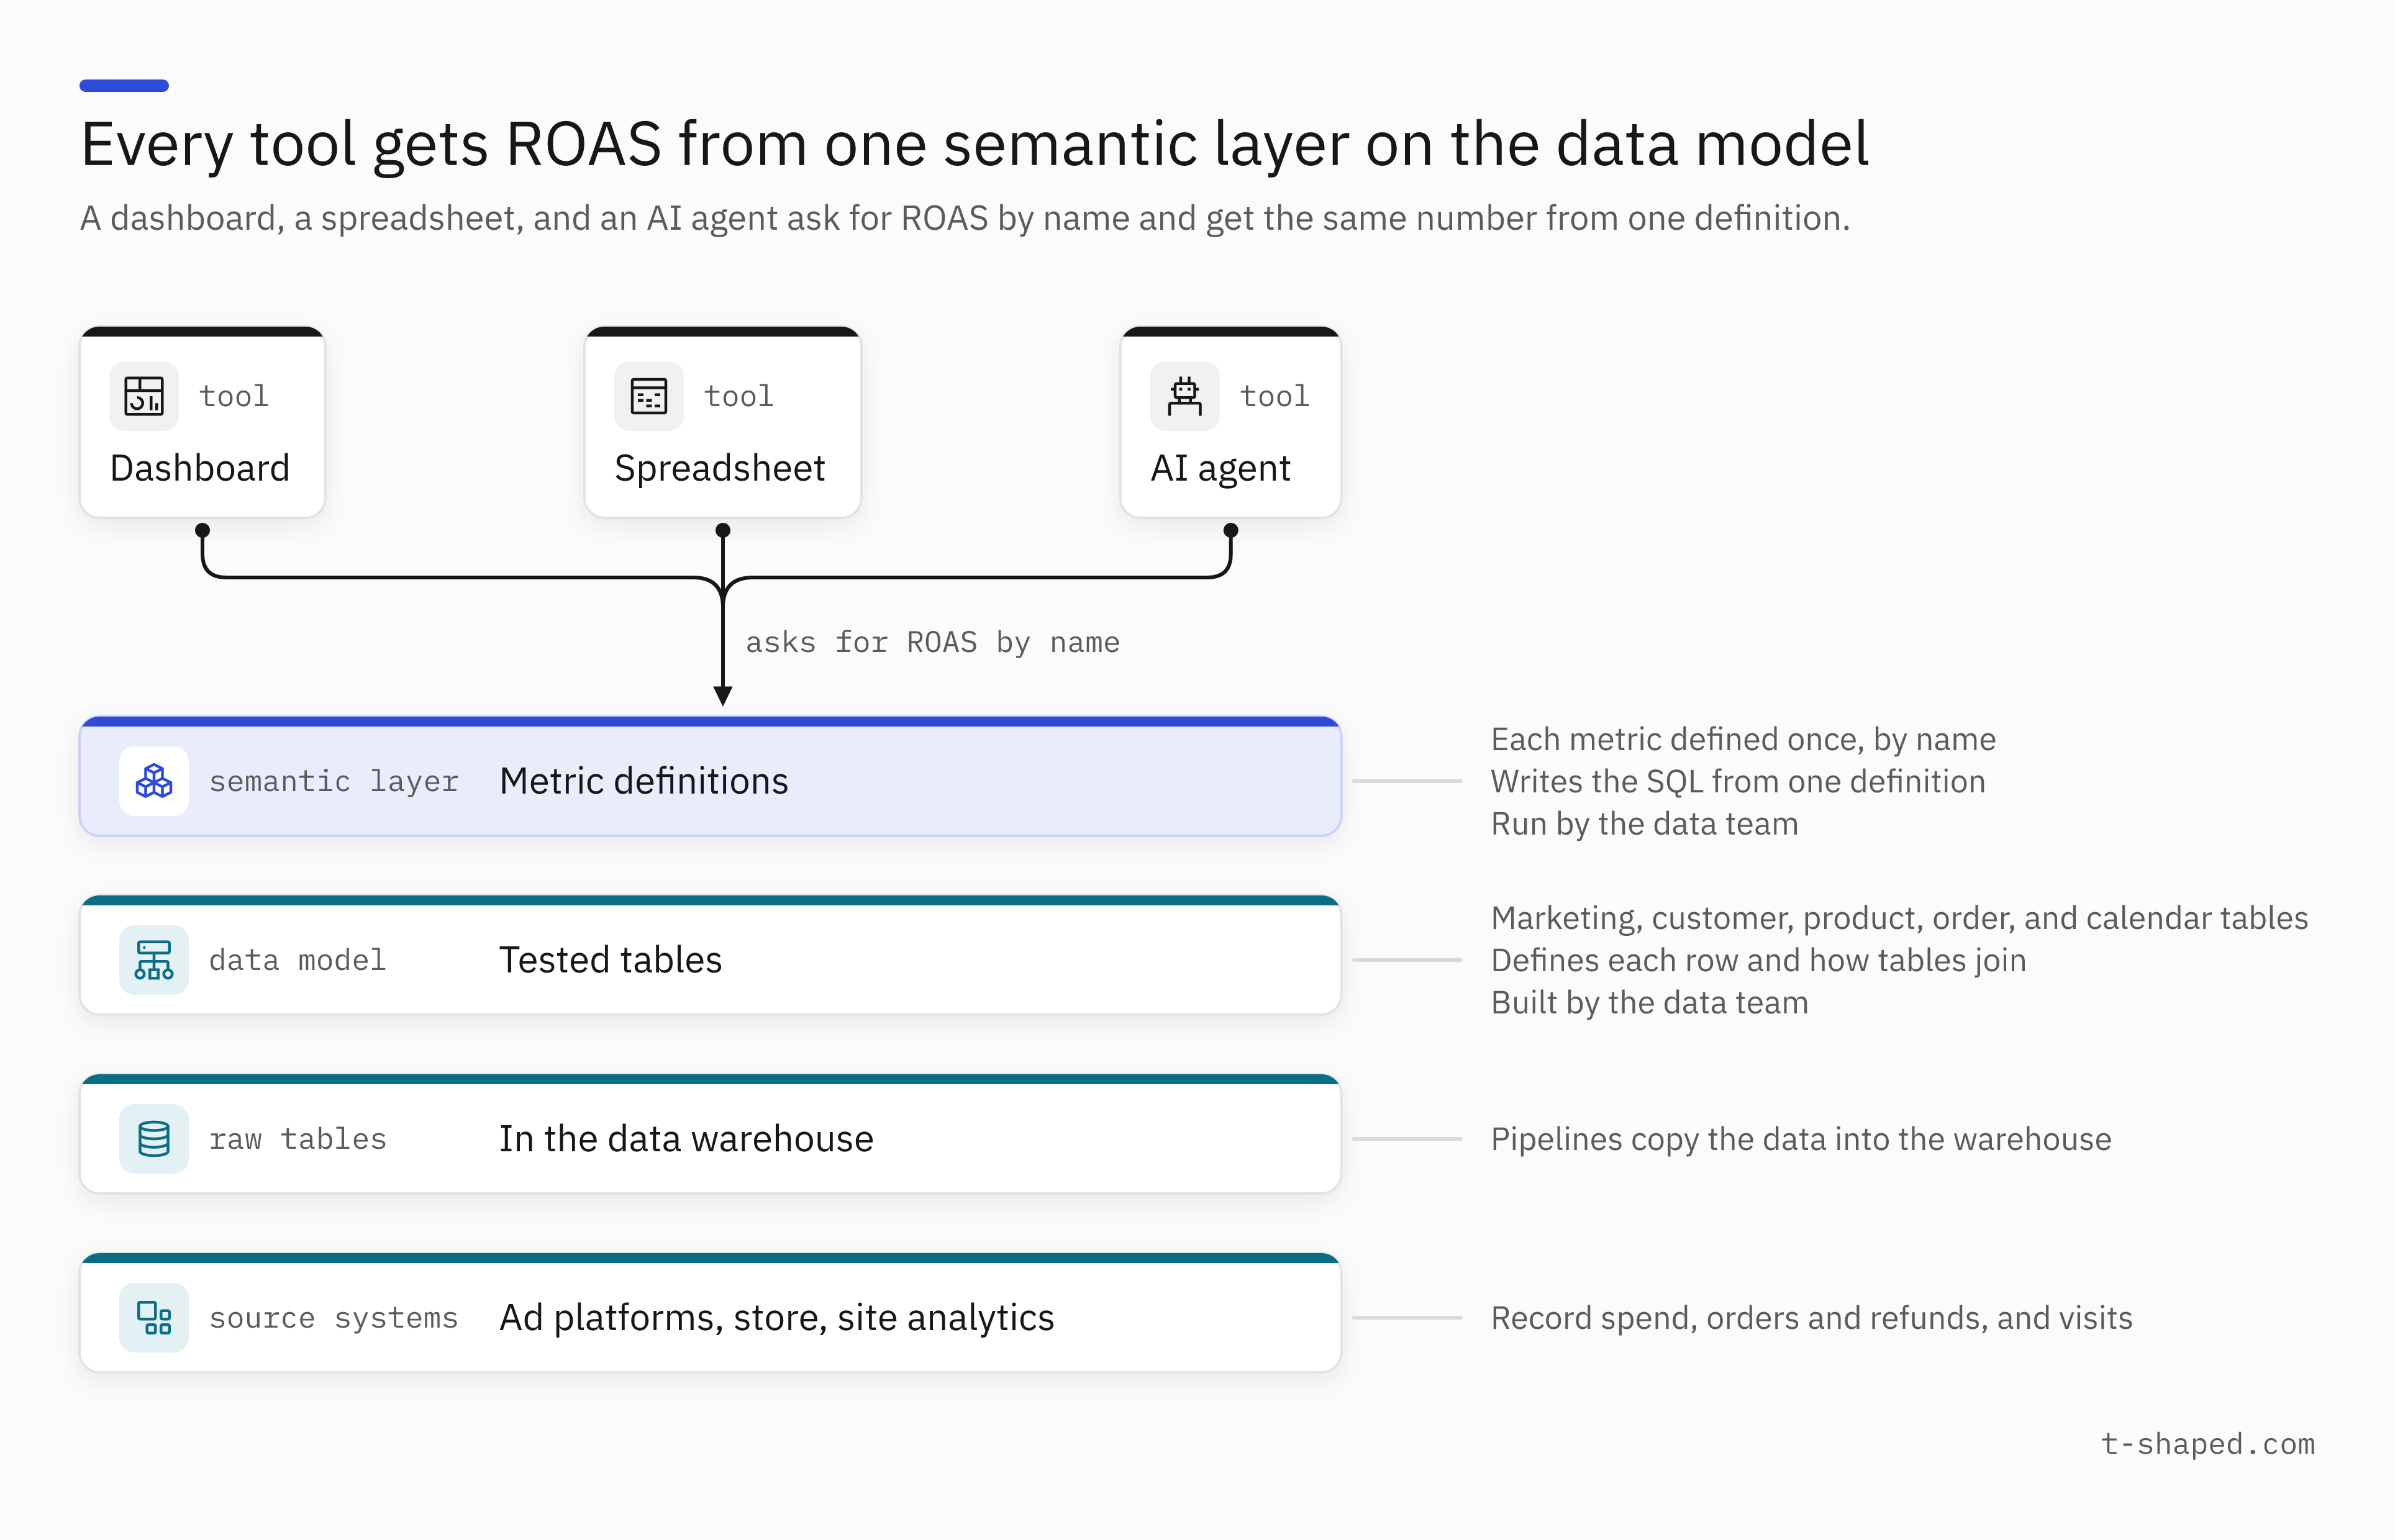
- Every reader goes through one semantic layer. Dashboards and agents ask for metrics by name, and agents get no raw SQL.
- Start small, with the metrics teams confuse. Revenue first, then attributed customer counts, each owned by the team closest to it.
- Test on every change, then grow from what people ask. Check the agent against the agreed numbers, rerun the tests automatically, and promote frequent questions.
Key facts
- On EntSQL, a 2026 benchmark from researchers including a team at Alibaba, the best system averaged 6.8% accuracy with the question and tables alone and 21.4% with notes written by experts9.
- As of October 22, 2026, on Spider 2.0, a benchmark of enterprise SQL tasks, the top-ranked system solved 96.70% of tasks on its Snowflake version, which supplies well-prepared table and column descriptions plus documentation7, 8.
- As of October 2026, Google's Ads Help expects discrepancies, often up to 20%, from different attribution models, with Google Analytics against Google Ads as its example6.
- As of October 2026, Snowflake's connector can offer a tool that runs SQL queries the agent writes, read-only by default, and Snowflake warns that putting that tool on the same connector lets the agent bypass the semantic views12.
- As of October 2026, Databricks gives this advice for its own AI agent, Genie: start as small as possible, with a limited set of questions, and aim for five or fewer tables3.
A core metric takes five steps from raw data to leaders
People load, shape, and check a core metric before it reaches senior leaders, and an AI tool that takes over part of that work has to be as careful.
Pipelines, tested tables, and an analyst stand behind each number
Take return on ad spend (ROAS) by channel last month at an example brand, made up for illustration, that sells online and buys ads on several platforms. Like every core metric that reaches leaders, it goes through five steps.
-
Step 1: The source systems record. Each ad platform records spend and the sales it credits to its own ads. The store records each order and refund. Site analytics records each visit and its source.
-
Step 2: Pipelines copy the data into the warehouse. A pipeline is any set of rules that moves data from one place to another; data teams call this step the ingest layer. Each pipeline pulls a system's data through its API, the interface the system offers for getting data out, into raw tables in the data warehouse, the database that holds it all for analysis.
-
Step 3: The transformation layer builds the data model. The data team reshapes raw data into governed tables, which it tests, documents, and owns. Each has a documented layout, called a schema. Together they are the data model. The work:
- filters out rows that do not belong, such as test orders
- removes duplicates and unused columns
- joins tables on a shared field such as a customer ID
- adds totals at more than one level, such as per order or per campaign per day
- credits each order to a channel by the brand's attribution rule
- records lineage, each number's path from its source through every table to the dashboard
-
Step 4: The dashboard divides revenue by spend. The data model carries spend and revenue by channel. ROAS, a calculation on top, sits in a business intelligence (BI) dashboard, a spreadsheet, and an analyst's saved query. A semantic layer would hold it once: a set of metric definitions, written in code, that sits between the data model and every tool that shows a number.
-
Step 5: The analyst runs quality assurance (QA). If ROAS doubles overnight, the analyst looks for a duplicated order, a missing refund, or a campaign credited to the wrong channel before the numbers go out.
Data teams have called this chain of cloud tools, which pass data to one another through SQL (the standard language for querying a database), the modern data stack. The joins live in code and the formula in the dashboard, but only the analyst knows which revenue the CMO means.
Download: SVG, PNG. Wider than the screen: swipe sideways, or download the PNG.
An AI agent on raw tables works without tests or definitions
An AI agent is a language model, the kind of AI behind ChatGPT and Claude, given tools such as one that runs a database query. Connected straight to the warehouse, it reads the table and column names, then writes and runs its own query.
| Governed data | AI agent on raw tables | |
|---|---|---|
| How tables join, and what one row stands for | Set in the data model and tested | Guessed from table and column names |
| Which revenue counts | Written in the metric's definition | Guessed on each question |
| The same request twice | The same number | A number that can change |
| Checked before it goes out | By the data team's tests and the analyst | By nobody |
The governed path has more steps, but the data team sets them up once.
In a semantic layer, each metric's definition has a named owner who agreed it. The data team tests it against the agreed numbers, the figures the business has signed off on. My view is that this check by people is the reason to build a semantic layer at all.
A marketing data model defines each row and how tables join
A data model rests on four parts, and the ROAS example shows how one wrong join repeats spend and returns a wrong number with no error.
The transformation layer builds the data model from these parts:
- Tables. Each holds one kind of record, such as ad spend or orders.
- Keys. A key is the column that identifies each row, such as an order ID.
- Grain. The grain is the table's level of detail, what exactly one row stands for: one order, or one campaign on one day.
- Joins. A join matches two tables on a key they share, such as orders and order lines (one row per product on an order) on the order ID.
Grain decides whether a count of rows is a count of orders
As of October 22, 2026, the commerce platform Shopify documents one event per row in its sales data, so one order can produce several rows when refunds or adjustments follow1. An agent that counts those rows counts a refund as another order.
Joining orders to their order lines repeats each order's total
In an example in Google's documentation for Looker, its BI tool, joining orders to their order lines on the order ID makes the sum of order totals 223.44 instead of the correct 124.84, because each order's total repeats once per line2.
Download: SVG, PNG. Wider than the screen: swipe sideways, or download the PNG.
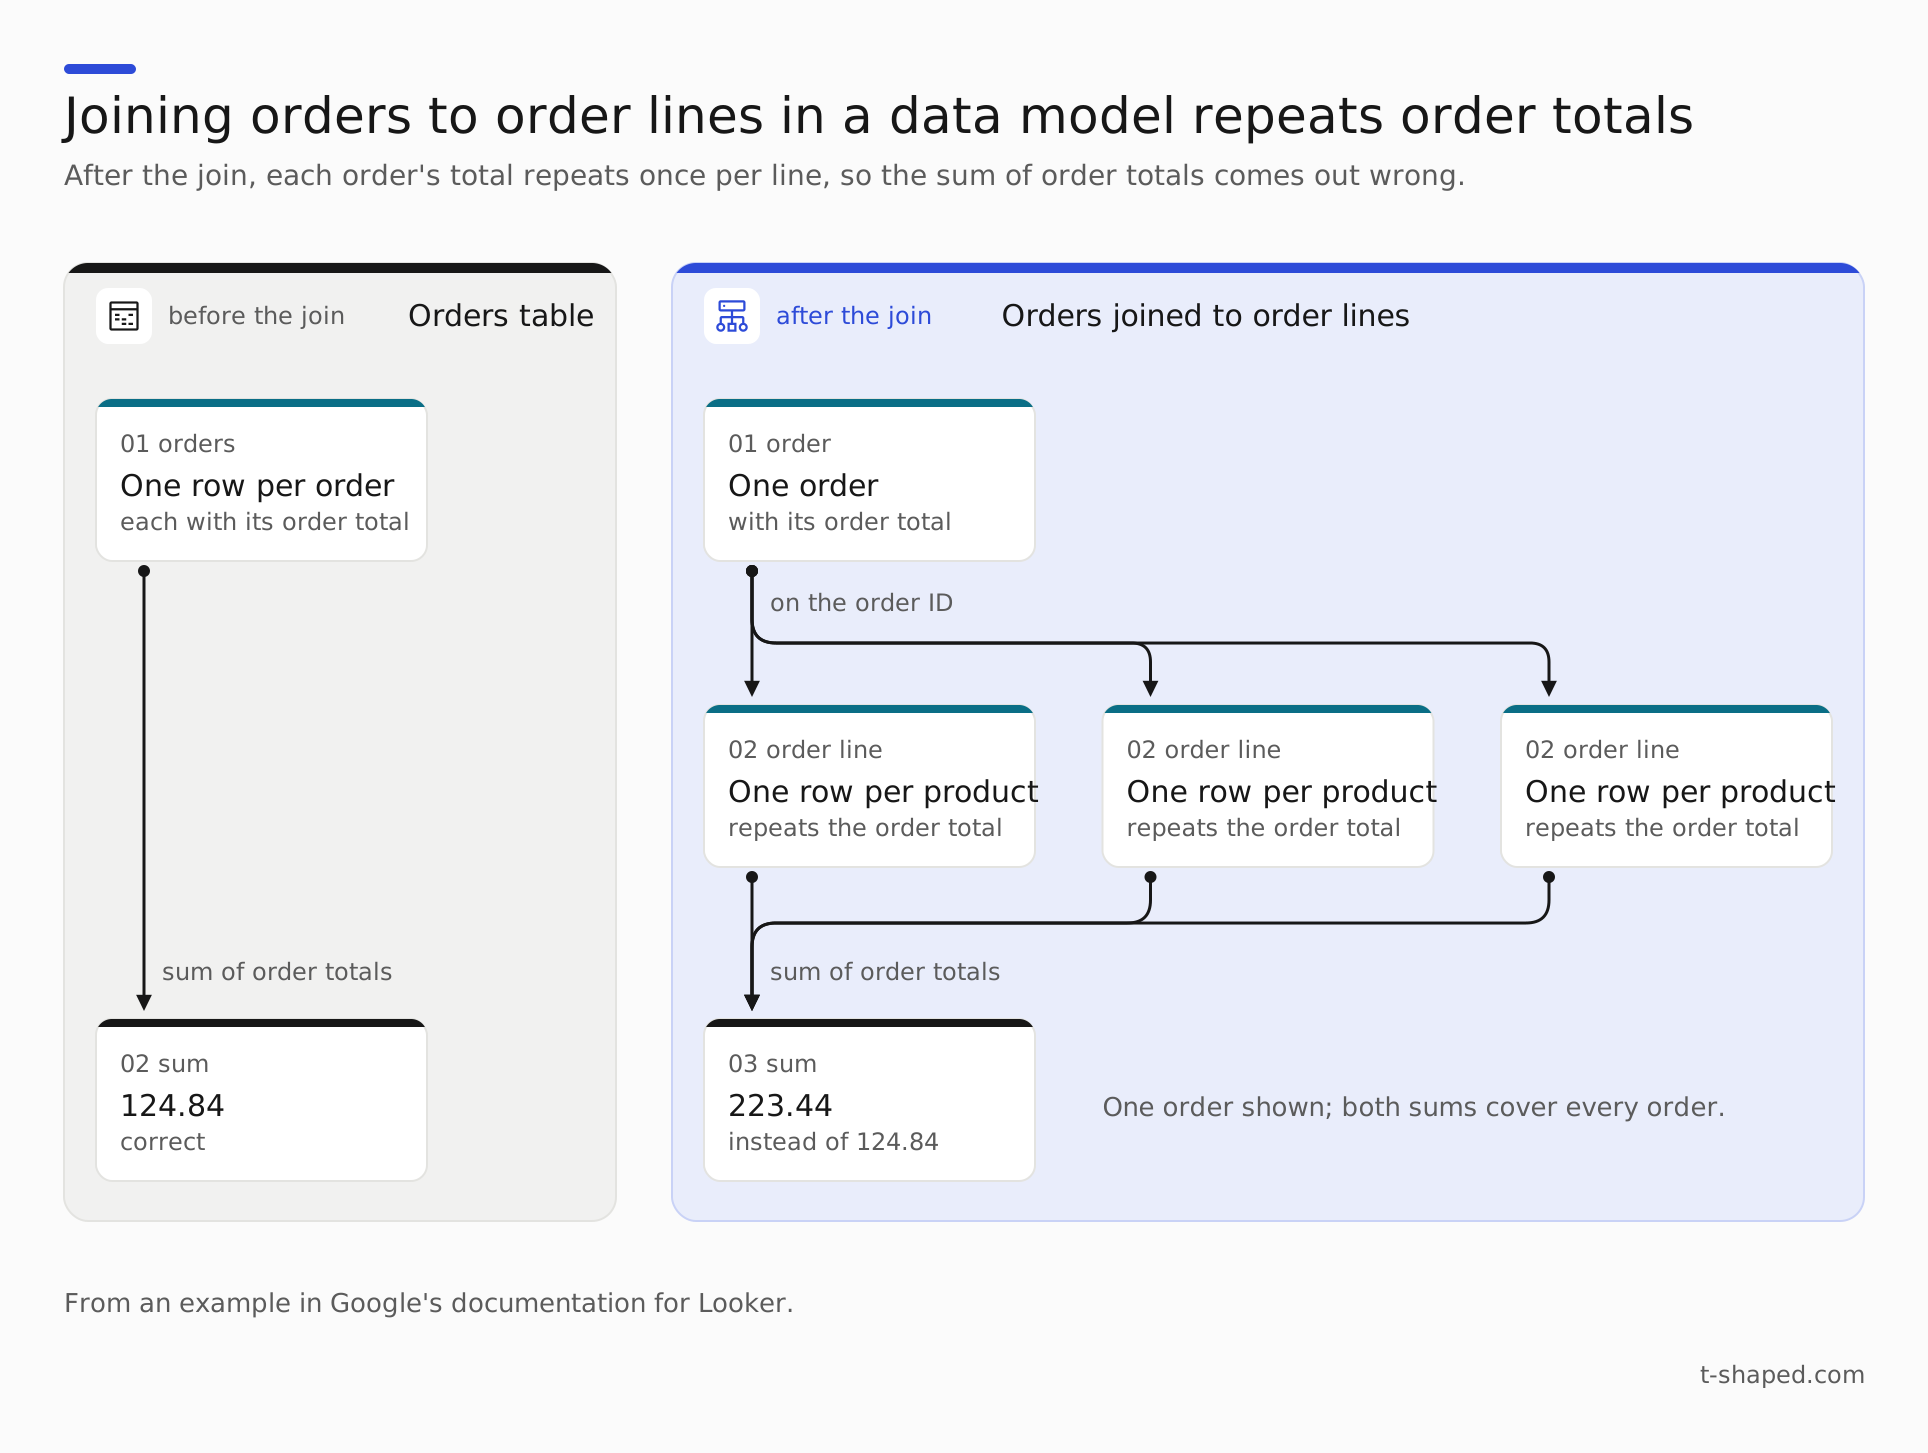
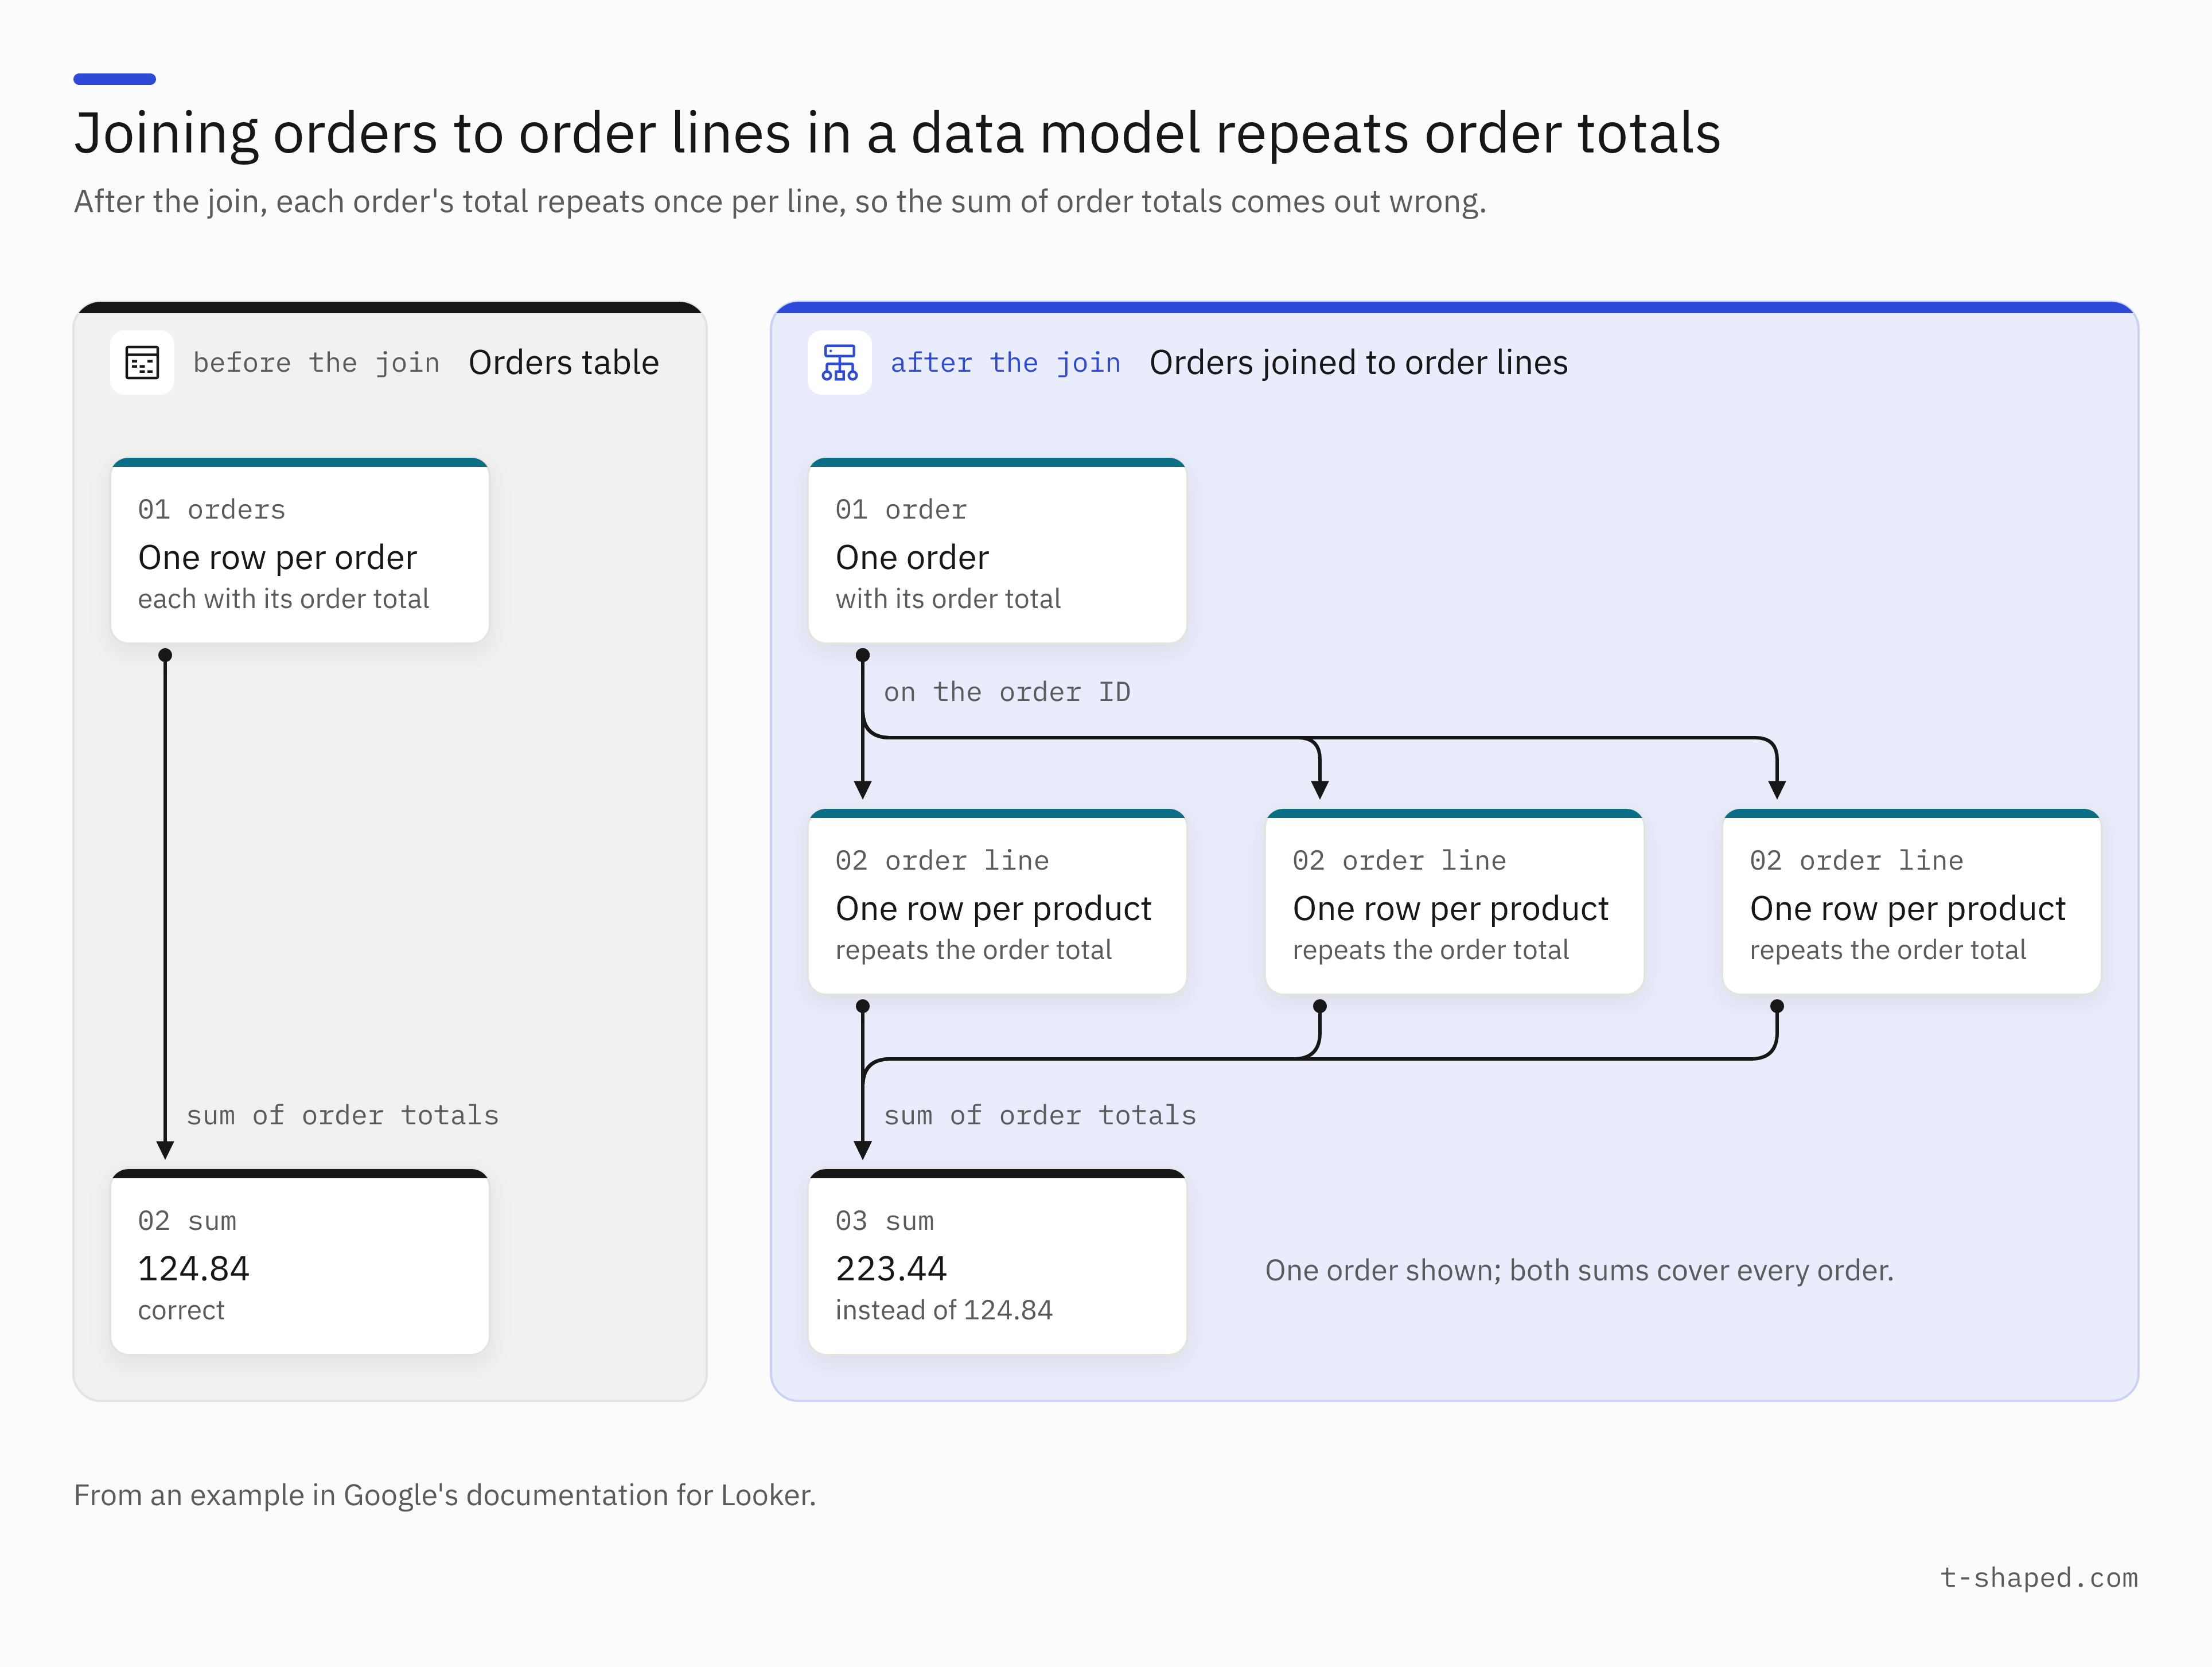
For ROAS, spend and orders sit at different grains. Add each up by channel and date first and line up only the totals.
The Kimball Group calls ratios non-additive, meaning they cannot be added up across rows, and says a good approach, where possible, is to store their parts. Add up the parts first and divide last. ROAS by channel is total revenue over total spend, never an average of each campaign's ROAS.
Data tests catch rows that break the data model's rules
dbt, the transformation tool dbt Labs sells, defines a data test as a query that looks for rows breaking a rule. The test passes when it finds none.
An AI agent needs marketing, customer, product, order, and calendar tables
An agent that spots patterns and predicts needs five kinds of tables, kept at a finer grain than your reporting has ever used.
A dashboard can run on totals, such as spend and revenue by channel by week. An agent needs the detail under the totals: each order, each ad, each customer. I'd build the data model at that grain from the start, then expand it and the semantic layer as people ask for more.
Take one question: which channel brought in the customers who later bought from a second product category. Answering it takes the channel credited with each first order, every later order, and each product's category.
Orders carry the channel credit that links ads to customers
- Marketing. Spend, clicks, and platform conversions by campaign, ad set, ad, and day, paid and organic, plus each campaign's channel.
- Customers. One row per customer, built from orders or the CRM (customer relationship management system), with a key that never changes and the first order date.
- Products. Each product with its category and product line.
- Orders and order lines. One row per order, with its customer, time, totals, and the channel the attribution rule credits. Under it, one row per order line, with the product.
Context tables explain why the numbers move
Numbers on their own are just numbers. Context data sits beside the performance data, so when a number jumps or an agent spots an anomaly, it can see what was happening at the time.
A calendar table maps each date to its fiscal period and holidays, so in the example brand, last month means the fiscal month. A promotion calendar records each offer and its dates, so a jump in ROAS can be read against the discount behind it. Seasons and promotions are the start; a brand adds context from other sources as its questions need it.
Finer grain lets an agent find trends, segments, and forecasts
With that grain in the data model, an agent can:
- find trends by channel, ad set, ad, or audience
- segment customers by what they buy, how often, and where they live
- forecast, by calling a forecasting tool on that history
- flag anomalies and act when a number crosses a trigger
The first defined metrics give finance an early result
Finance's best case against this work: an agent sold for data questions can be bought today, and a data project with no visible output is the first budget line cut. The bought agent needs the same definitions: Databricks, which makes an AI agent called Genie, tells teams to define metrics and filters for Genie in SQL, with written instructions only as a last resort3. The first defined metrics are also a result finance can see early.
Revenue is a different number in every system that reports it
When several systems report revenue, an agent left to choose has no way to know which one you mean.
As of October 22, 2026, the example brand's store, ad platforms, and site analytics each calculate revenue differently, and some see only part of the sales4. Ask an agent for revenue with no definitions in place and it picks one, and you won't know which.
Each version still has a job. Attributed revenue from the ad platforms or site analytics compares channels and campaigns. The store's or the finance system's number is what the business actually booked.
Five settings decide which revenue a system shows
- Gross or net. Whether discounts, refunds, shipping, and tax are in the number.
- Attribution window. How long after a click or a view a sale still counts for the ad.
- Attribution model. The rule for which ad gets the credit when a person saw several.
- Counting date. The day of the click, or the day of the purchase.
- Tracking. A tool counts only the sales its tracking sends it.
| System | How it counts revenue (each system's documentation as of October 22, 2026, unless a row gives an earlier date) |
|---|---|
| Shopify (the store) | Net sales are gross sales minus discounts minus sales reversals; shipping charges, taxes, duties, and fees enter only at total sales1 |
| Google Ads | Its main conversion columns count on the day of the click, not the day of the sale |
| Meta | Reports default values based on each advertiser's attribution setting, with other click and view windows also available, per an October 16, 2025 post |
| Its Conversion insights report credits the last Pin a person engaged with before checkout, organic or ad, and shows 1-day view and 30-day click when no window is set5 | |
| Google Analytics 4 | Purchase revenue subtracts refunds; gross purchase revenue does not |
| Adobe Analytics | Adds up the price the site's tracking sends with each purchase |
Google's Ads Help expects discrepancies, often up to 20%, from different attribution models, with Google Analytics against Google Ads as its example6.
The semantic layer names each version of revenue
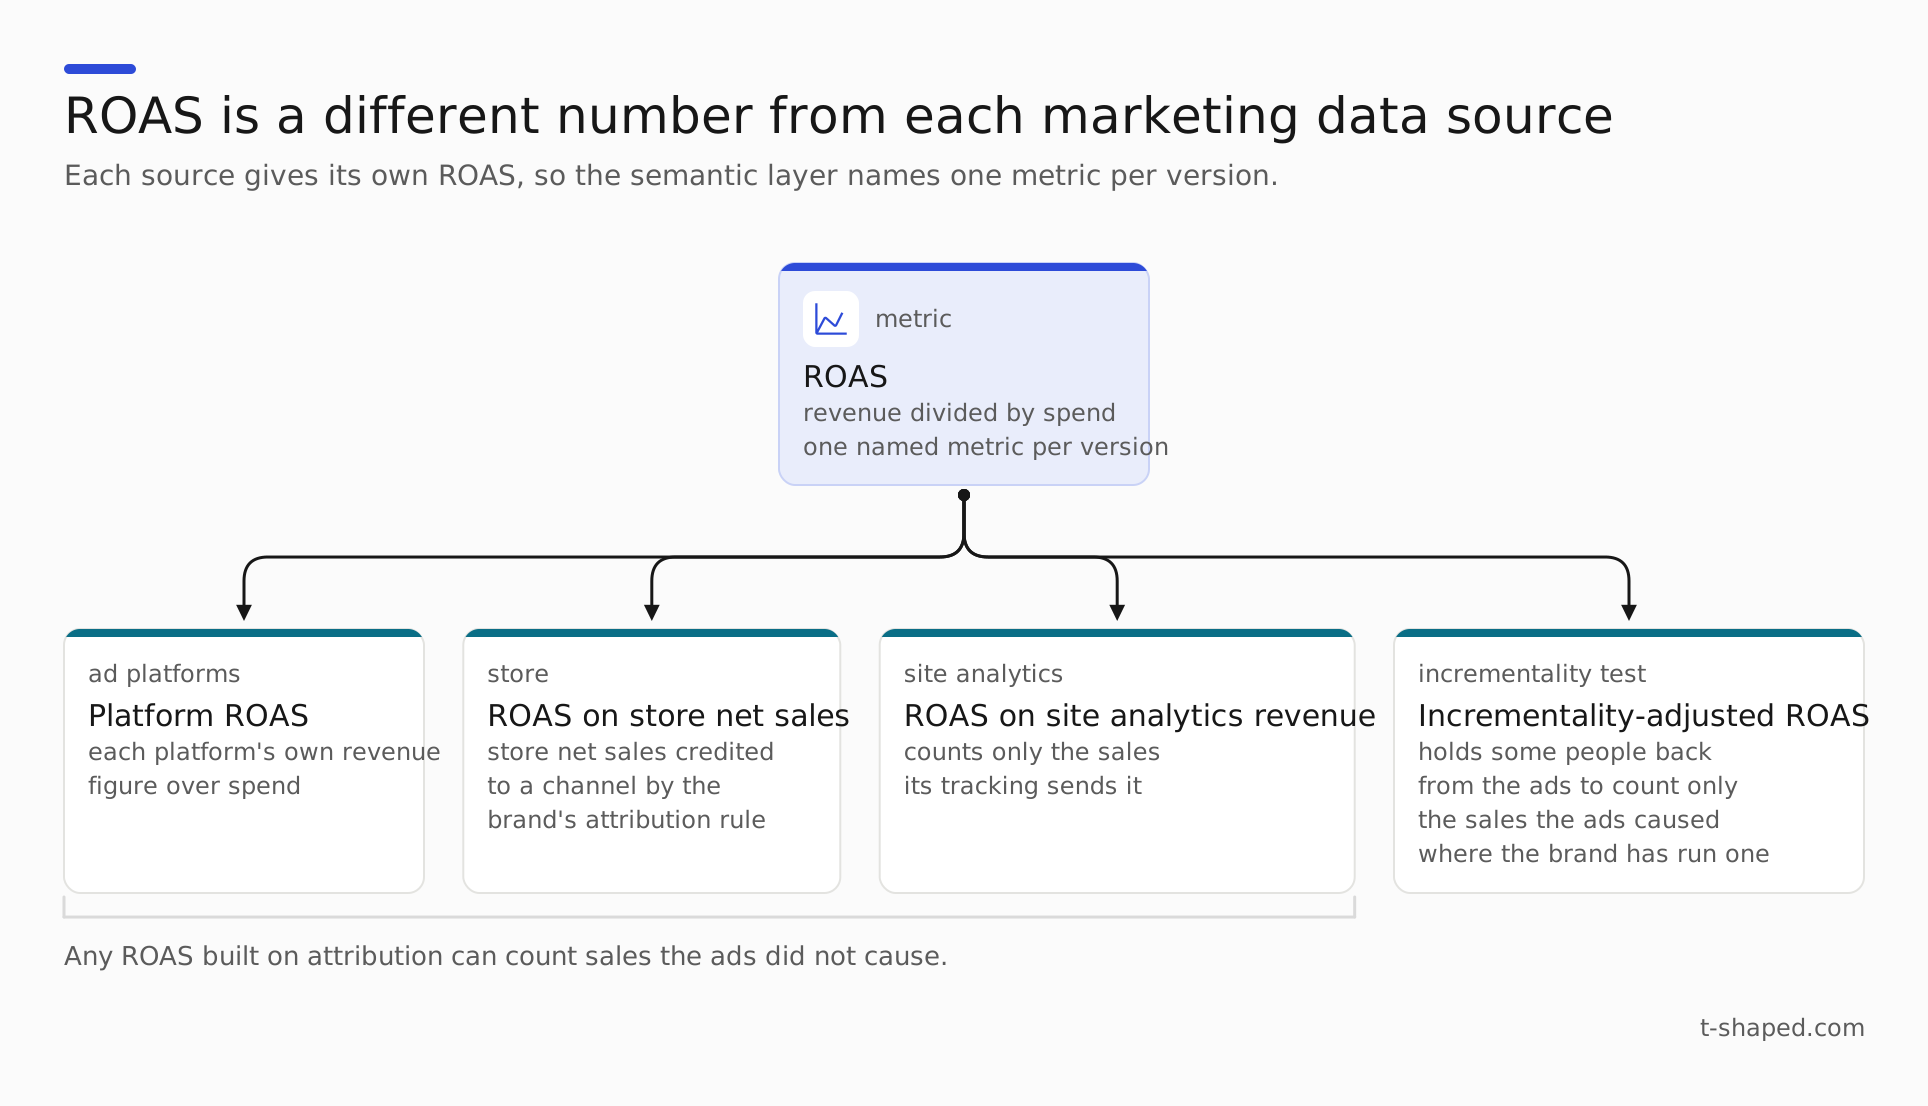
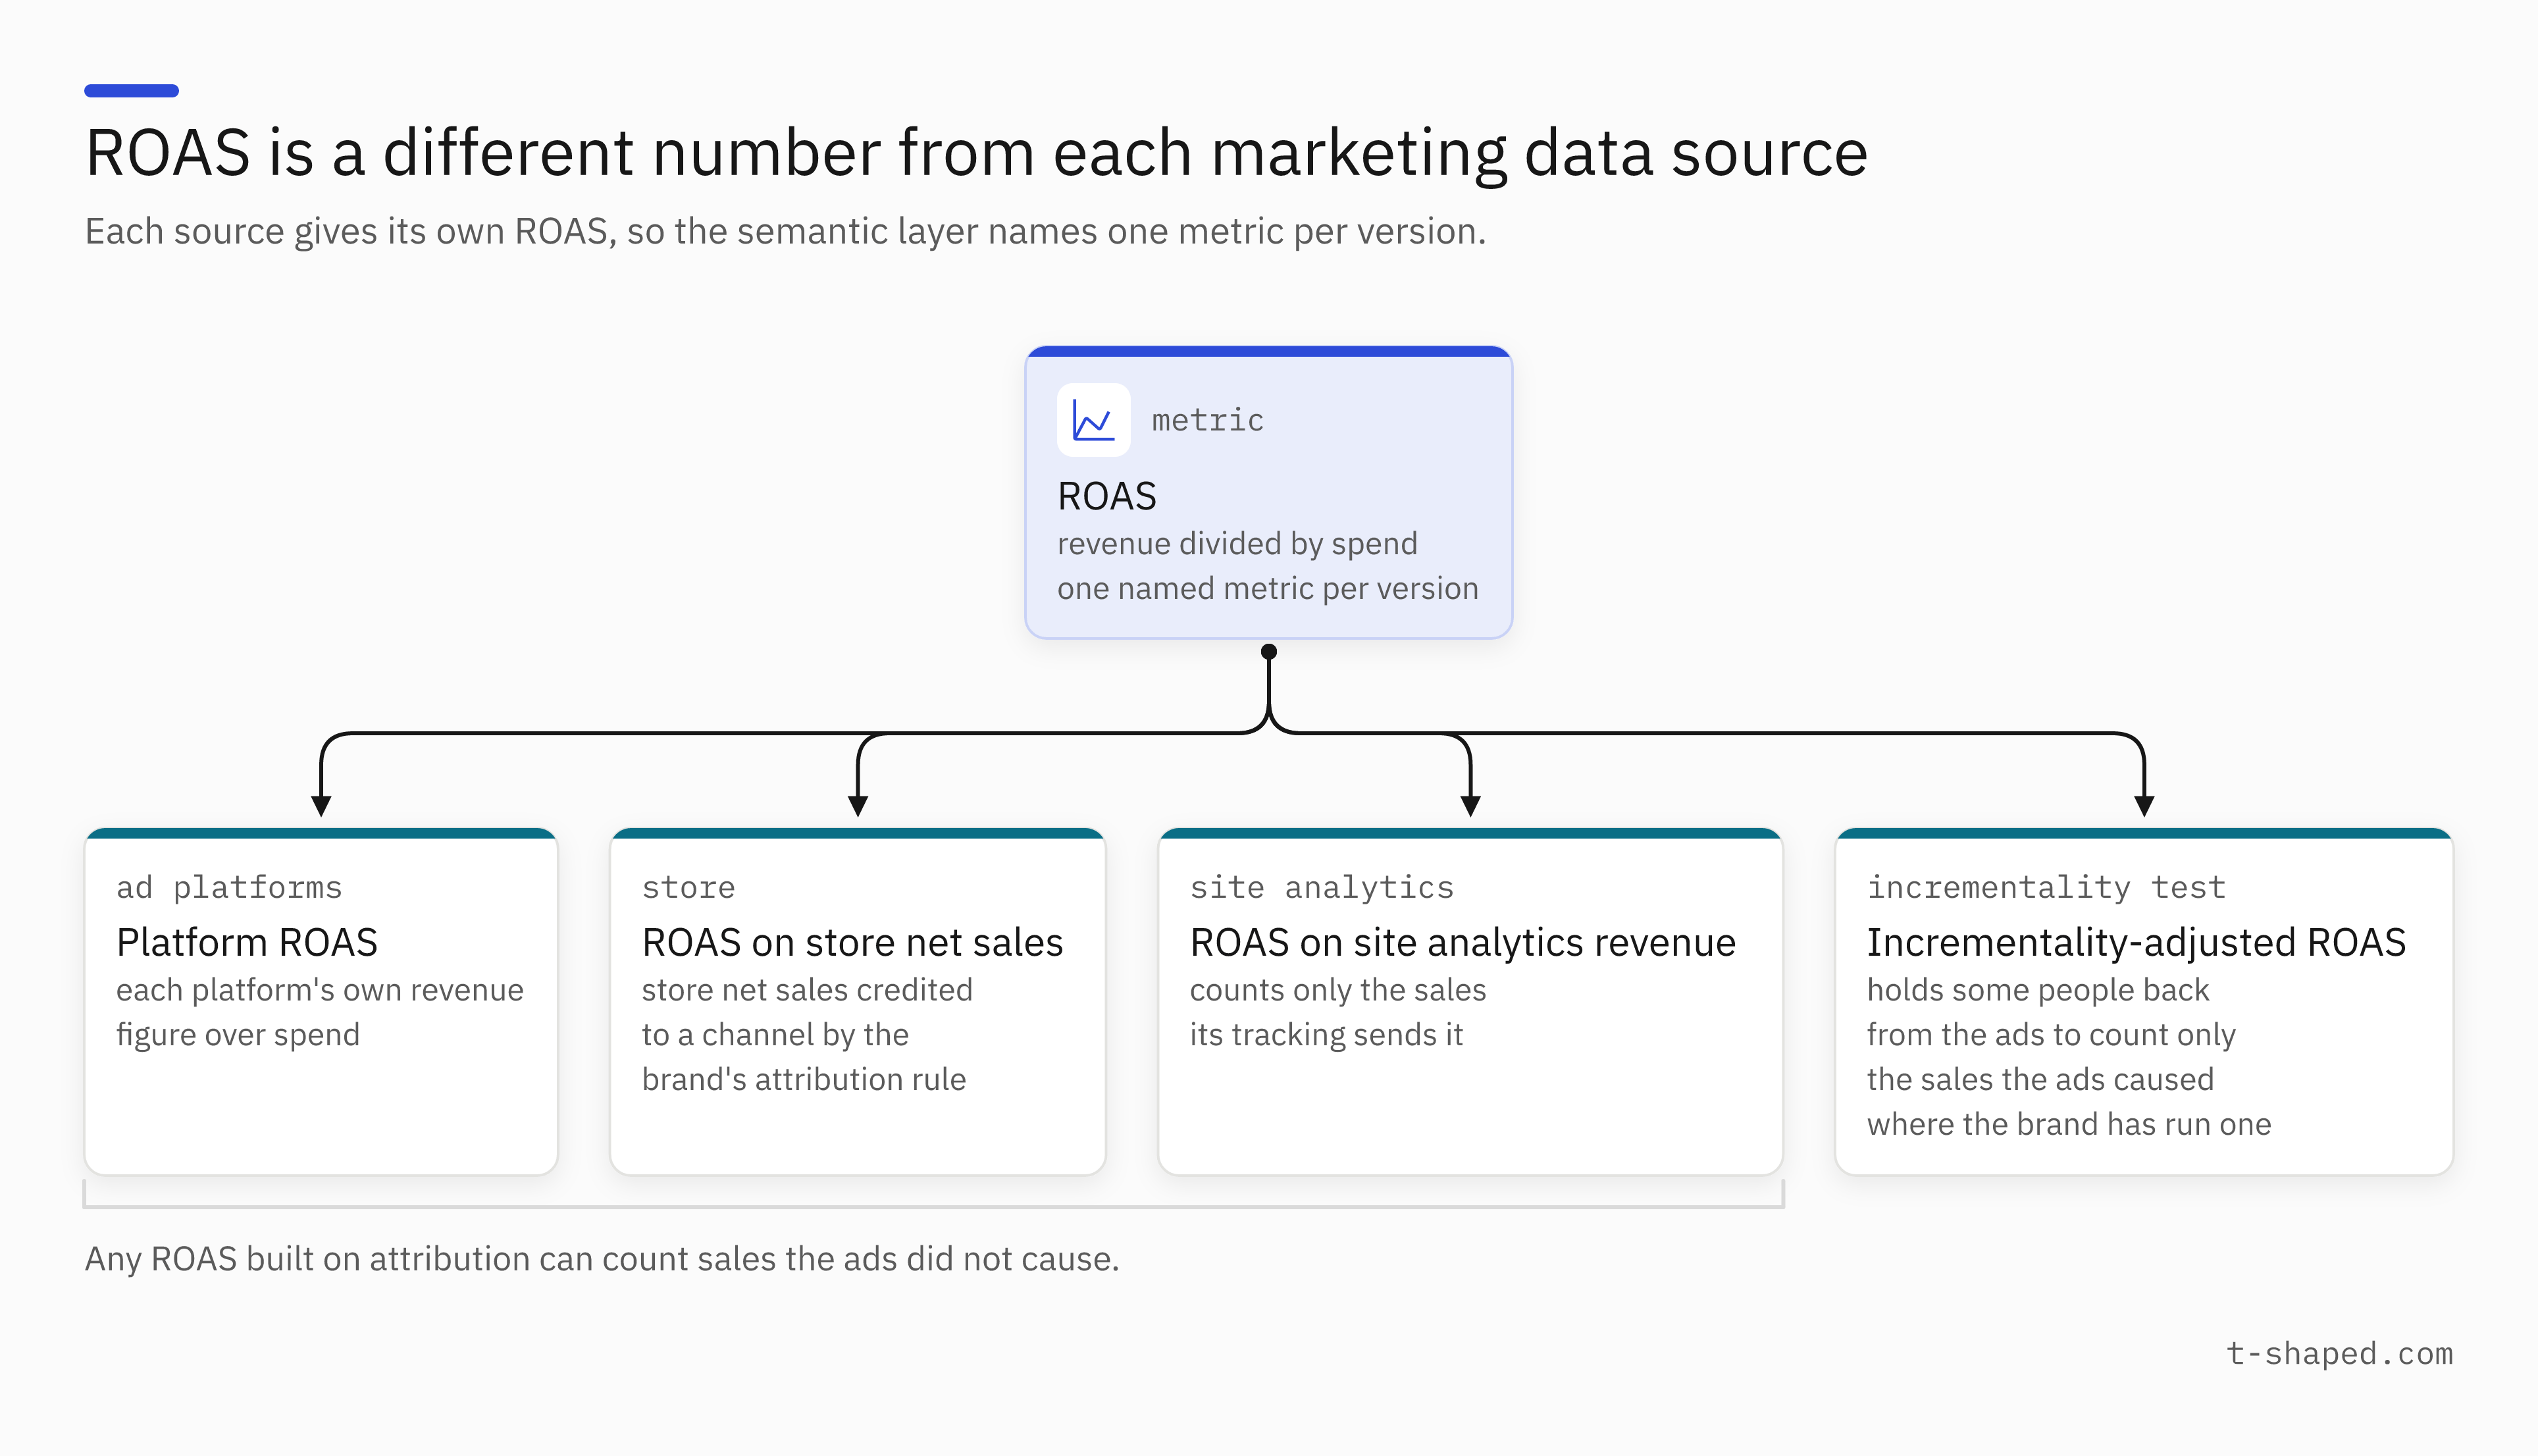
The semantic layer gives each version a name and a plain description of its source and its five settings. The agent picks a version by reading those descriptions.
For a brand that sells through its own store, my default is the store's net sales. A question that names no version of revenue gets the store's net sales, and the answer names the version it used. The data team writes that default into the store net sales description and into the agent's standing instructions, the written rules it reads before every question.
A question about one platform, such as Meta's ROAS, is different. The agent first asks whether the person means Meta's own revenue figure or the store's sales credited to Meta.
I recommend the same for ROAS: one named metric per version, as the first section's figure shows.
Any ROAS built on attribution can count sales the ads did not cause. An incrementality test holds some people back from the ads to count only the sales the ads caused. If your team runs those tests, add the ROAS they measure as its own named version. When the team moves budget between channels, it relies on those tests or a media mix model, a statistical analysis of each channel's effect on sales.
An AI agent writing SQL guesses which revenue you meant
A language model predicts its way to a query, and on a real warehouse it predicts wrong too often for numbers people act on.
A language model is a prediction machine. Asked for ROAS by channel, it reads the table and column names it can see, guesses how the tables relate, and writes the query its best guess supports. Every guess returns a plausible number. That is the problem.
With a small set of tables, clear column names, documentation, and fairly clean data, those guesses get good. Spider 2.0 is a benchmark of enterprise SQL tasks7. As of October 22, 2026, the top-ranked system solved 96.70% of tasks on its Snowflake version, which supplies well-prepared table and column descriptions plus documentation8.
Real warehouses have sprawl the benchmarks leave out
Real warehouses hold staging and production views, copies, aggregated versions, and tables named orders, orders_v2, and orders_final. On EntSQL, the 2026 benchmark from researchers including a team at Alibaba, the best system averaged 6.8% accuracy with the question and tables alone and 21.4% with notes written by experts9.
For numbers people act on, even ninety percent accurate is not good enough. In five studies, the researcher Berkeley Dietvorst and two colleagues found that people lose confidence in an algorithm faster than in a human forecaster after seeing both make the same mistake, even when the algorithm did better10. Their tasks were forecasts, not dashboard numbers. My view is that a wrong number in a meeting costs an agent trust the same way. So my answer to the case that language models now write strong SQL: the agent still has to be told exactly where the answers are. That is the data model's and the semantic layer's job.
A semantic layer writes each metric's query from one written definition
The ROAS example shows how a semantic layer turns a request by name into one query, and where its help stops.
Semantic layers name their tables and joins before any metric
dbt's semantic layer, for example, describes each data model table it reads and names the type of every join key. Then the layer defines metrics and dimensions. Dimensions are the ways a metric can be split, such as by channel or by month.
A named request becomes the same SQL every time
A dashboard or an agent asks for a metric by name, with dimensions, filters, and dates. The layer finds the path between the tables from the declared keys, writes the SQL, and returns the number with the definition used.
dbt Labs says the same request produces the same SQL each time11. The joins and the formula are no longer the agent's job. It still picks the metric, filters, and dates, and that choice can vary between asks.
A ROAS definition is a short YAML file in dbt's format
Here is the example brand's ROAS definition, an illustration written as a YAML file, the plain-text format dbt's semantic layer uses for metric definitions. The file sits in version control, a record of every change, so each edit carries a date and a reason.
metrics:
  # the name every tool asks for
  - name: roas_store_net_sales
    label: "ROAS on store net sales"
    # what the agent reads
    description: >-
      Store net sales credited to a channel by the brand's
      attribution rule, over ad spend. Test orders excluded.
      Fiscal months, store time zone.
    # one total over another
    type: ratio
    type_params:
      numerator: store_net_sales
      denominator: ad_spend
    filter: "is_test_order = false"
    config:
      meta:
        synonyms: ["return on ad spend", "ROAS"]
        time_zone: "store time zone"
        counting_date: "order date for sales, spend date for spend"
        attribution: "last click, the brand's chosen window"
        # the team that owns it
        owner: "acquisition team lead"
        # the data team runs the layer
        maintained_by: "@analytics_engineering"
A semantic layer cannot fix bad data or undefined metrics
A semantic layer built on raw tables repeats their errors in every answer, and it serves only the metrics someone wrote down. A metric read the same way everywhere can still overstate what the ads caused.
Marketers' AI agents should query only the semantic layer's metrics
The tools a connector offers, as of October 22, 2026, and the login an agent runs under decide whether its answers stay inside the defined metrics.
The agent lists the defined metrics, then asks for one by name
A connector is a service that offers an agent a named list of tools, such as list metrics or query a metric. The ones here use the Model Context Protocol (MCP), a specification for connecting AI agents to outside tools, and are called MCP servers. The instructions dbt ships with its connector set the order:
- They tell the agent to first ask for the metrics and dimensions it can use.
- The agent then queries the metric by name, such as total_sales grouped by month for total sales last month.
- When no defined metric fits, the instructions tell the agent not to query, and to say what is available and suggest a close question it can answer.
A SQL tool on the same connector goes around the definitions
Snowflake's connector can offer a tool that runs SQL queries the agent writes, read-only by default. Snowflake warns that putting that tool on the same connector lets the agent bypass the semantic views12, Snowflake's name for its semantic layer definitions. The person asking can't tell which path an answer took.
My rule is stricter. Marketers' agents get the defined metrics and no raw SQL connection. The data team sets up their connector with no tool that lets the agent write and run its own SQL against the tables. The agents get no warehouse login of their own.
Download: SVG, PNG, MP4. Wider than the screen: swipe sideways, or download the PNG.
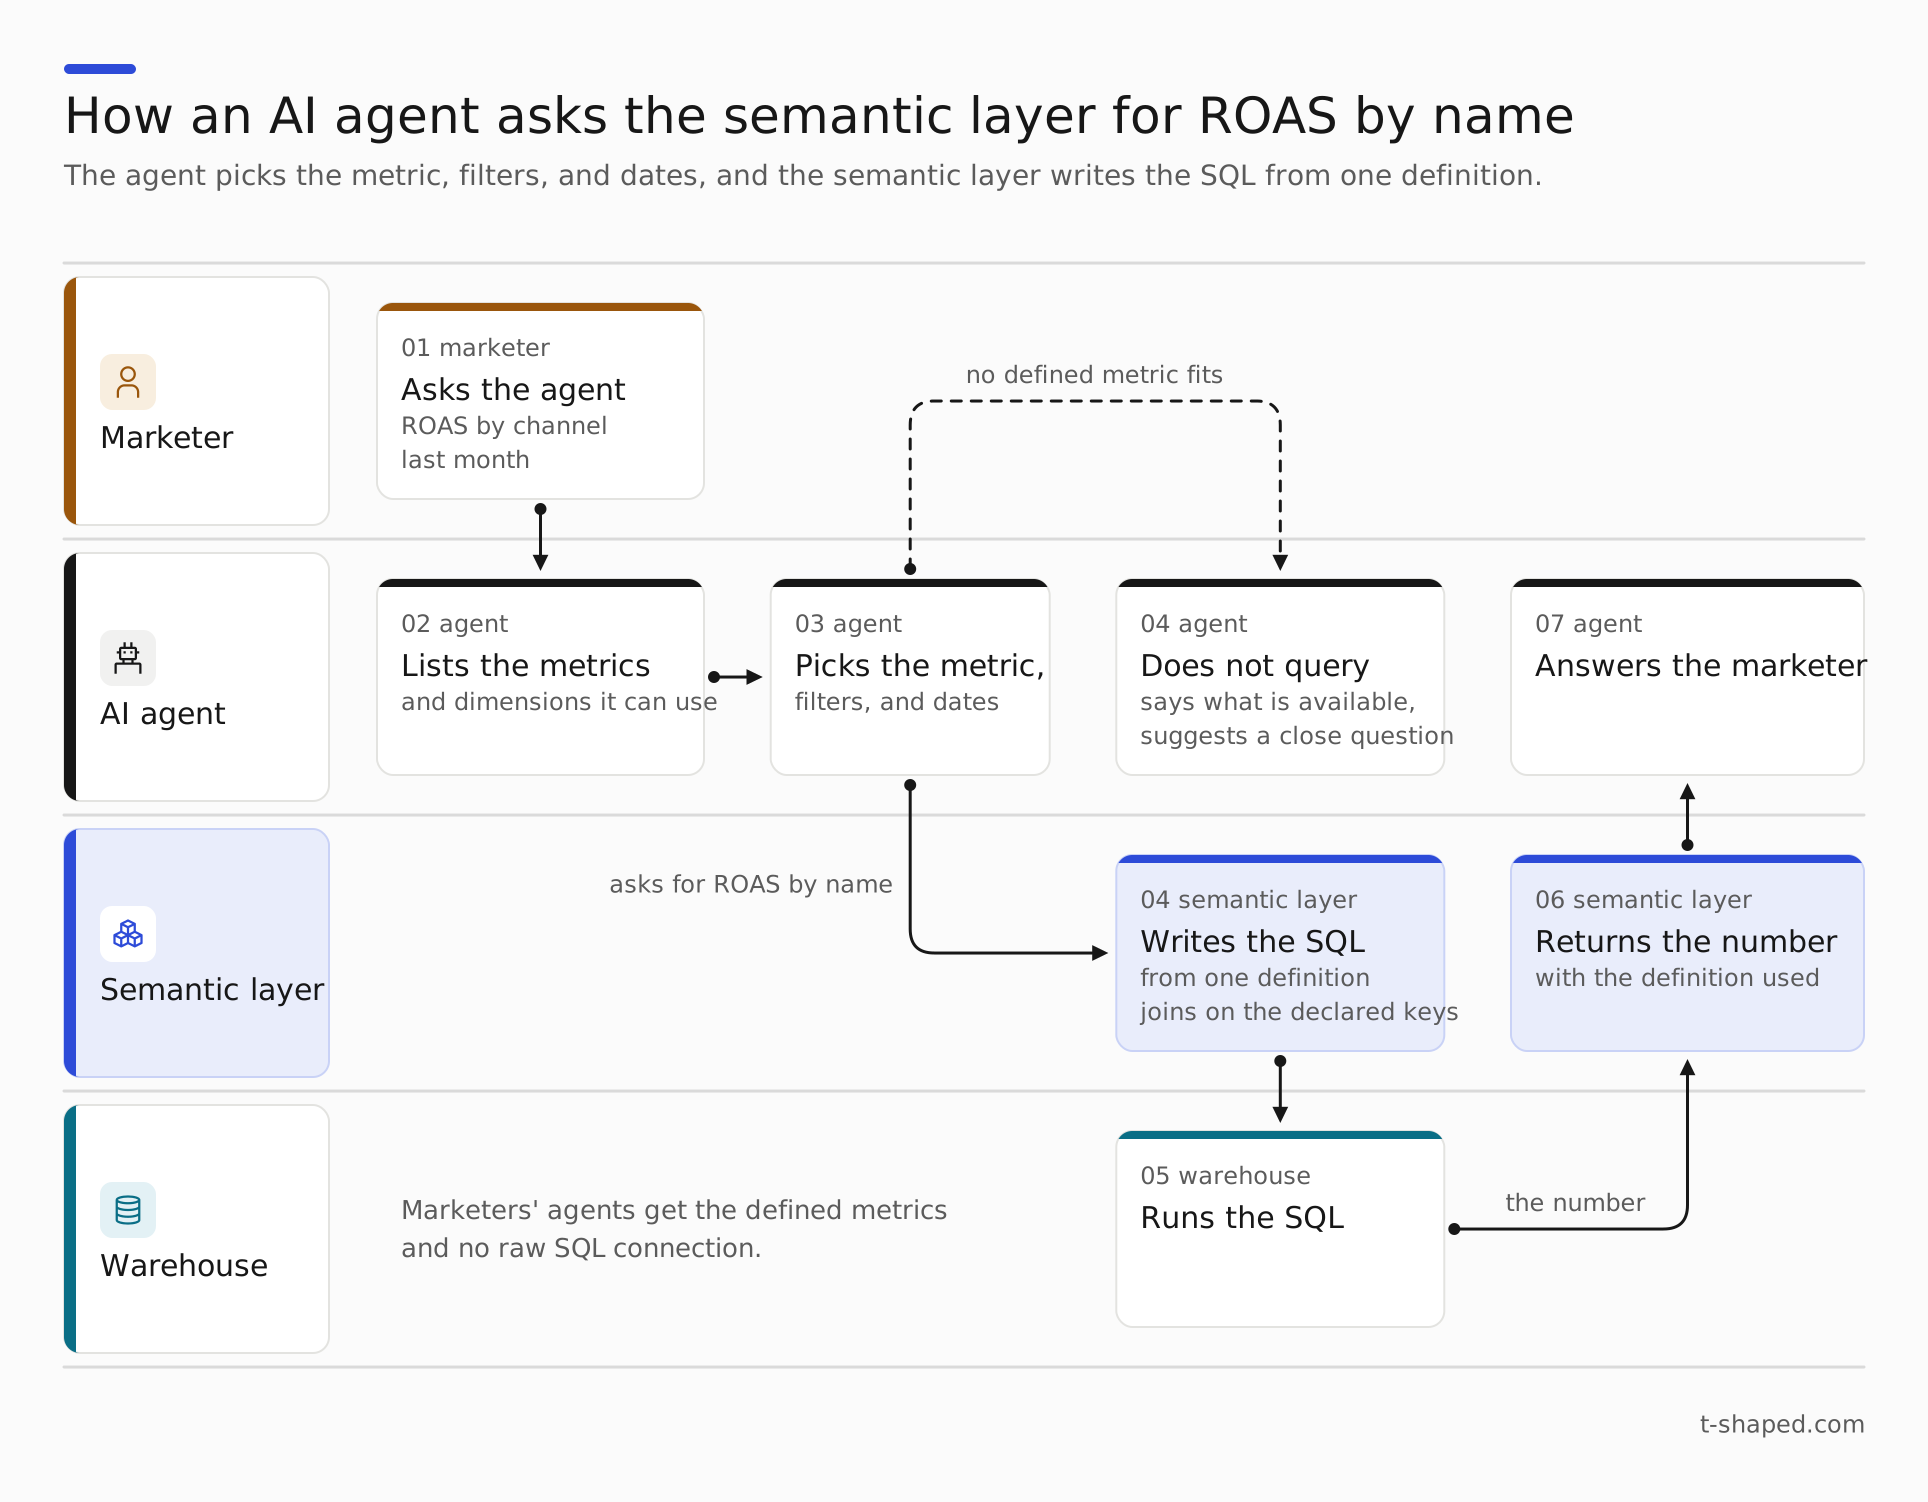
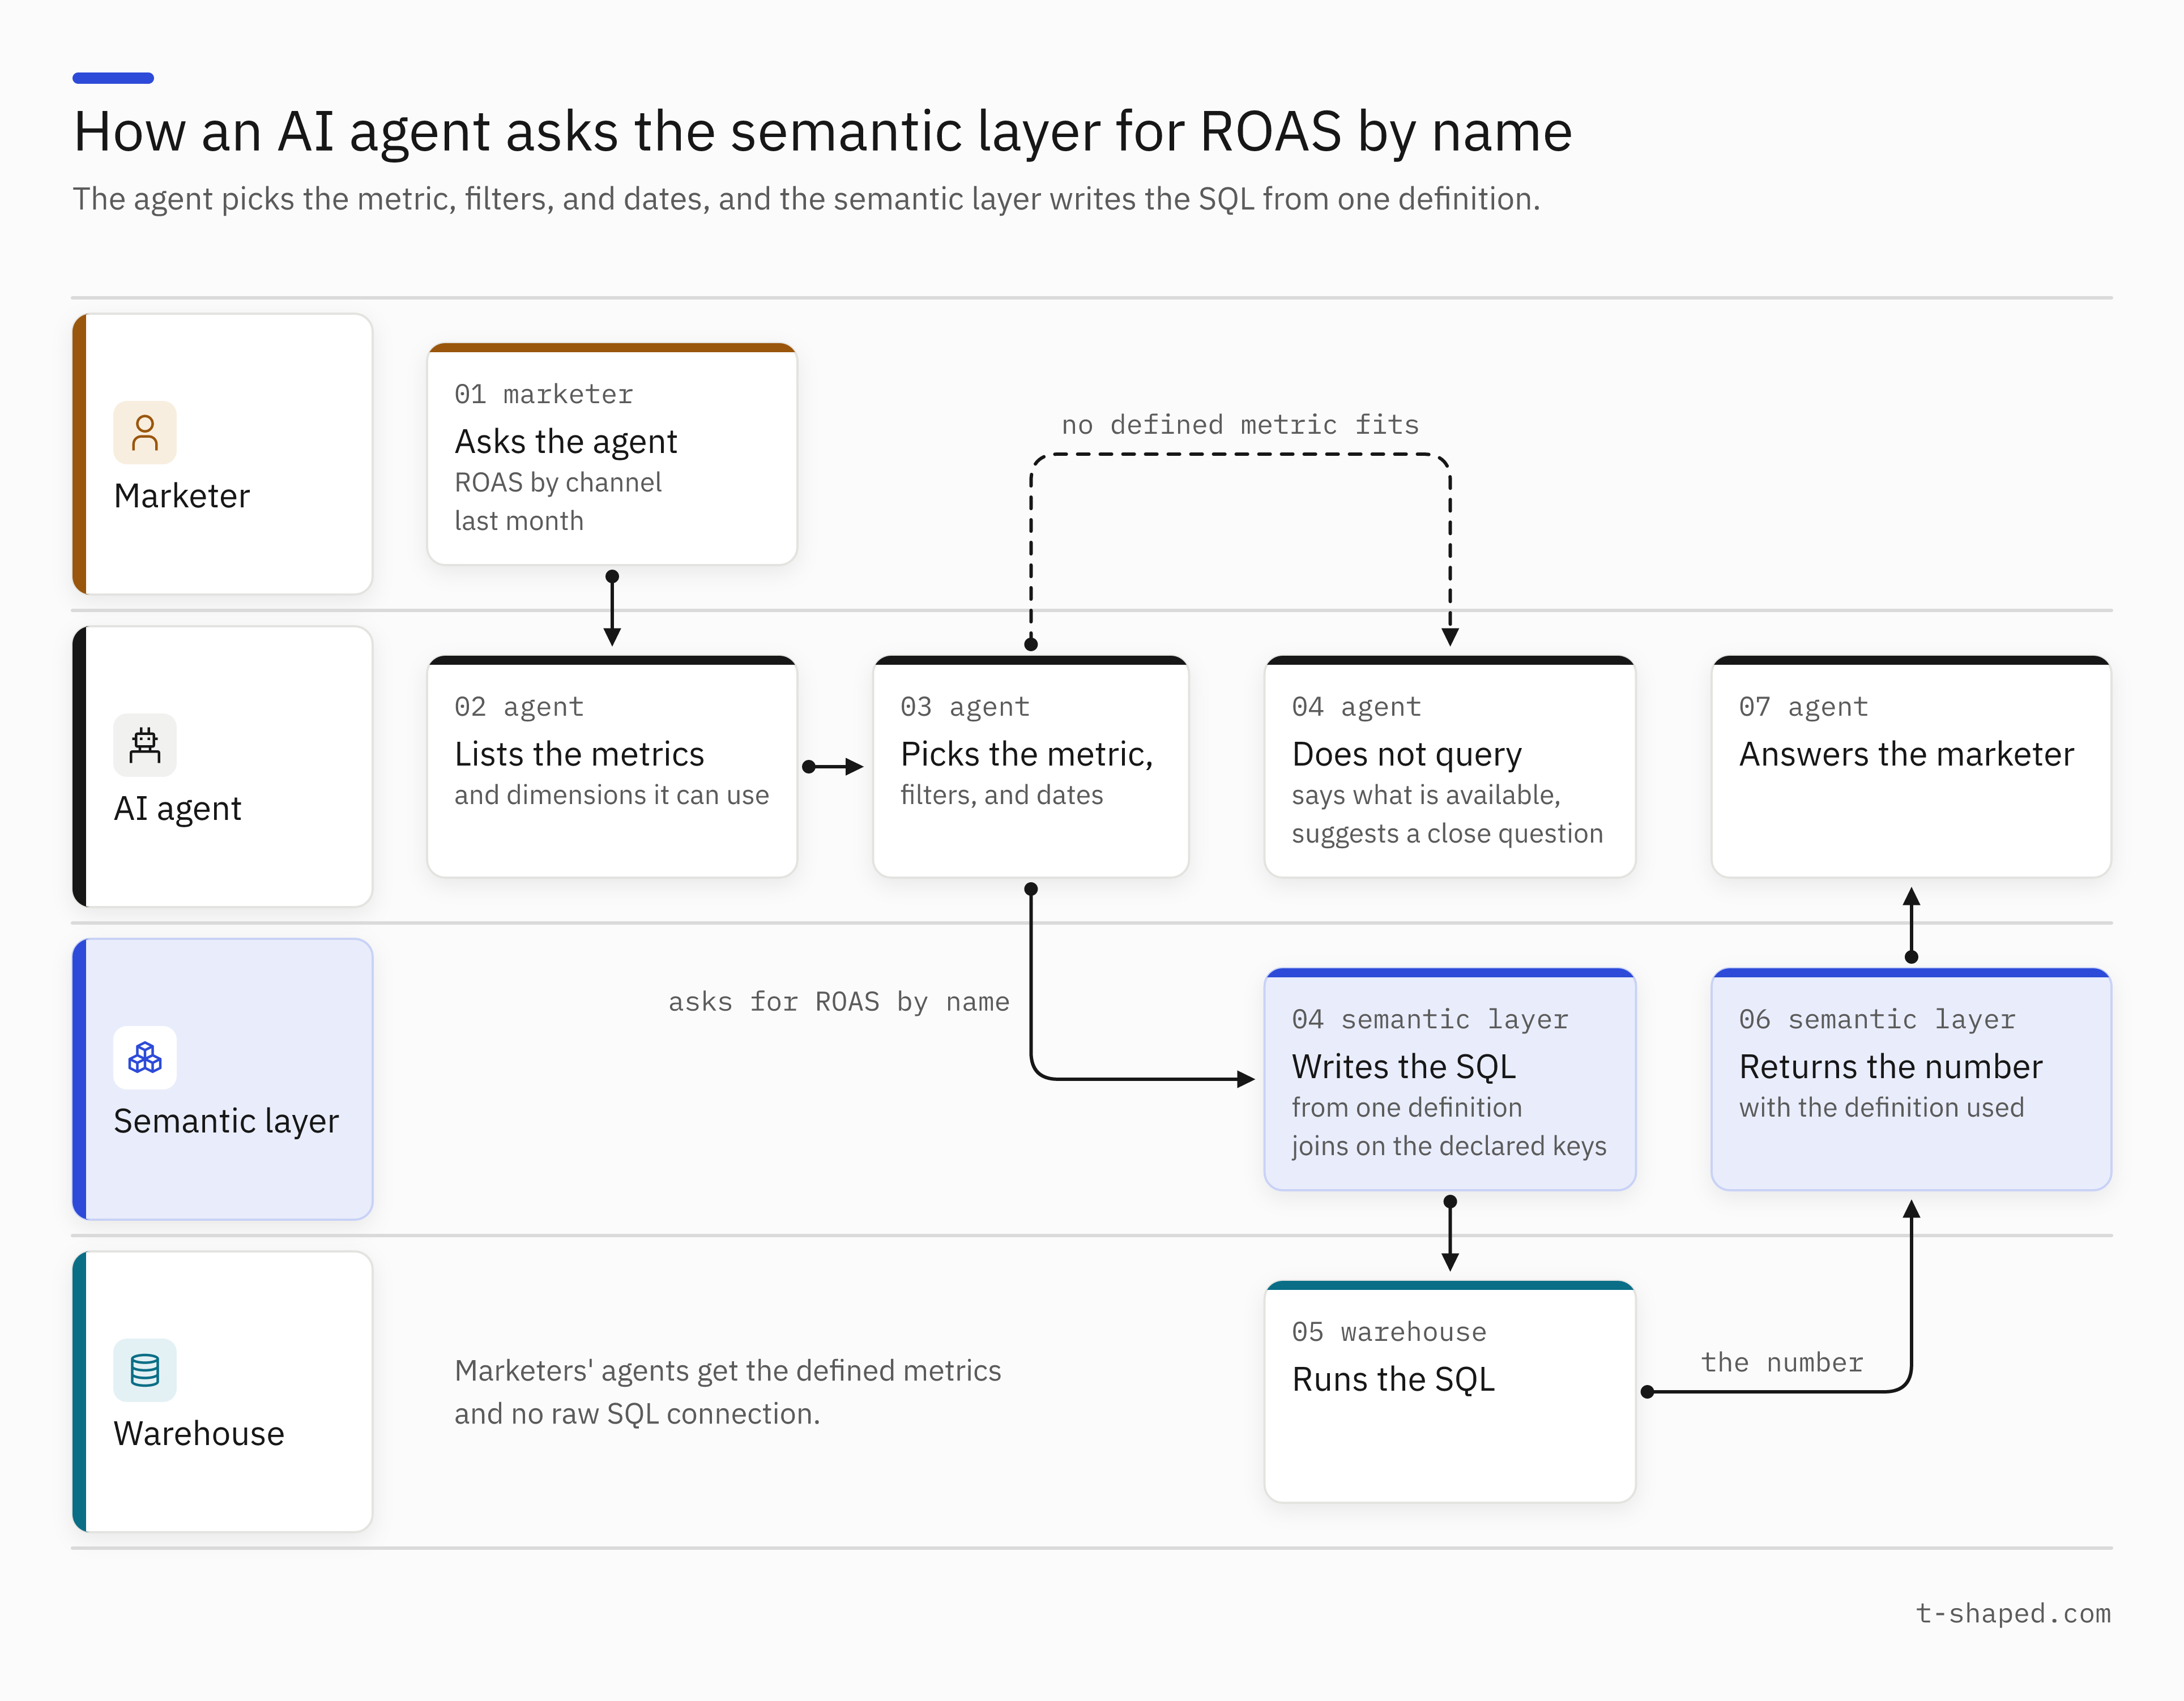
My advice has one exception. Some useful data is semi-structured or not governed yet, and sometimes you want an agent to reason over it. Then the answer has to say so: mark which parts came from that data, list every source the agent pulled from, and make the person asking own the result, knowing it may be wrong. Anything that touches reporting, financial planning, forecasting, or accounting stays inside the semantic layer, with no exceptions.
The agent sees only what the asking person may see
Microsoft, the maker of Power BI and Copilot, its AI tool, says Fabric IQ serves Power BI data to Copilot and custom agents. It answers plain-language questions within Power BI's row-level security, the rules that limit which rows each person sees.
The numbers still leave your systems. Microsoft notes that query results go to the AI tool the agent runs in, which might pass them to its language model provider13. Legal should check that tool's terms on whether the provider keeps or trains on the results.
BI tools can hold the semantic layer if agents query them
If an AI agent outside your BI tool can ask it for a metric by name, and see only what the asking person may see, the BI tool is your semantic layer.
If your dashboards run on Looker or Power BI, some of your metric definitions already live there. The question is whether to keep them there.
Ask your data team one question: can an AI agent outside the BI tool ask it for ROAS by name, under the asking person's permissions?
- Yes: leave the definitions where they are. Moving them means rewriting every one and keeping two copies in step.
- No: move them to a layer agents can reach. dbt Labs argues that moving definitions out of the BI layer lets data teams feel confident that business units work from the same definitions "regardless of their tool of choice"14.
Wherever the layer lives, every reader goes through it. Every dashboard, spreadsheet, and AI agent asks the same layer through its API or connector. A reader that goes around it, to a raw table or a second set of definitions, is where key numbers start to disagree.
Here is how each home for the definitions answers that question.
| Where the definitions live | Example | How outside tools and agents reach it (each vendor's own pages, as of October 22, 2026) |
|---|---|---|
| A modeling tool | dbt | An API, a Python kit, a database driver, and an MCP server for AI tools such as Claude and ChatGPT |
| The warehouse | Snowflake semantic views | A standard SQL query |
| The warehouse | Databricks metric views | Power BI, Tableau, Sigma, and other outside BI tools |
| The BI platform | Looker | An MCP server for agents, in a preview that excludes customer-hosted Looker |
| The BI platform | Power BI | Fabric IQ, which Microsoft names as the supported path for Copilot and custom agents |
| A standalone product | Cube | An MCP server that runs every tool as the signed-in user, with row-level security |
If your metrics live only in spreadsheets today, the choice is open. Pick a home your dashboards and your agents can both reach, and keep one set of definitions in it. If you change BI tools later, plan on converting the definitions yourself.
Knowledge graphs and ontologies build on the semantic layer's definitions
The three get confused: a semantic layer defines the numbers, an ontology defines the business's things and how they relate, and a knowledge graph holds the actual records.
| Semantic layer | Ontology | Knowledge graph | |
|---|---|---|---|
| What it defines | Each metric, once, such as ROAS or net sales | The kinds of things a business has and how they relate, such as a customer placing an order | Nothing new; it follows the ontology |
| What it holds | Formulas, filters, owners, descriptions | Types of things, relationships, rules | Each actual customer, order, and product, linked to each other |
| A question it answers | What was ROAS by channel last month? | What counts as a customer, and what can a customer do? | Which products did this campaign's customers buy next? |
A question about connections still ends in a number, so it still needs that number defined. Define the metrics first, and add an ontology when your team's questions start to follow connections.
Start the data model and semantic layer small, then grow them
The first build covers only the metrics people already ask about, and the agent reaches nothing else.
Databricks gives the same advice for its own agent: start as small as possible, with a limited set of questions, and aim for five or fewer tables3.
The first build follows the questions people already ask
The data team works in this order. A brand without a data team gives the same steps to whoever builds its dashboards today, in-house or at an agency.
-
List the questions. Collect what people email the analysts and ask in the weekly meeting. Alex Merced, who works at the semantic layer maker Dremio, calls the SQL behind a team's top 30 dashboard tiles a ready-made list of questions with reviewed answers15.
-
Trace each answer to where its logic lives today: a dashboard, a spreadsheet, a saved query, or someone's memory.
-
Build the tables those metrics need first, from data already in the warehouse, working toward the minimum of marketing, customer, product, and order tables. If marketing data is not in a warehouse yet, loading it comes before this step.
-
Write each definition with the parts the ROAS definition shows, its owner included.
-
Connect an agent to those metrics alone, and test it before marketers use it.
-
Add the next domain only once the agent's answers match each owner's number on every test question.
The metrics teams confuse most come first
Prioritize the metrics where two teams quote two different numbers. Revenue is the most common. Attributed customer counts come next, such as new customers by channel and the customer acquisition cost (CAC) built on them.
Attributed counts rest on an attribution rule that can be wrong. That is fine once the definition names the rule and the window, so every tool applies the same credit.
Then define the rest of what marketing already tracks, from spend and orders to conversion rate, total customers, and platform metrics such as impressions.
Define churn and LTV the way your business measures them
Your business decides what counts as a churned, reactivated, or newly acquired customer, not a platform's default. The tools already disagree on churn and lifetime value (LTV). Name each version, and pick the one that counts:
- LTV from past orders. Email marketing company Klaviyo's historic customer lifetime value is the total value of a customer's previous orders, accounting for refunds and cancellations.
- LTV over a fixed period. In Amplitude's product analytics, N-day LTV is a group's revenue in the first N days or other time units after their first activity, divided by the number in the group.
- Churn by time since the last order. Commerce customers typically have no cancel event, so the guide for Adobe's commerce analytics product counts a customer as churned after a set time without an order.
Each metric has an owner, usually the team closest to it
My view is that the data team runs the semantic layer, and each metric's definition has an owner who knows what the number should count. Ownership usually follows the domain:
- Lifecycle or retention team: customers, LTV, and churn.
- Acquisition team: CAC, and often ROAS.
- Finance: the transactional side, such as orders, customer totals, and return rates.
In a team too small for these groups, one person can own several metrics. Each definition still names one owner.
The data team asks each group how it calculates and uses a metric, compares the answers, and records the owner in the definition. When marketing and finance disagree on revenue and one version must win, the data team brings both sides to a decision and writes it into the definition.
Data is AI-ready when the agent matches your agreed numbers
Accuracy is the point: the data team checks the agent against agreed answers before marketers rely on it, and again on every change after.
Once people see a wrong number, they stop trusting the agent, and then there is little point to it. I'd rather start with a smaller set of data that is right every time than a larger one with errors in it.
Marketers get the agent once it passes the test questions
The data team runs the check in order:
-
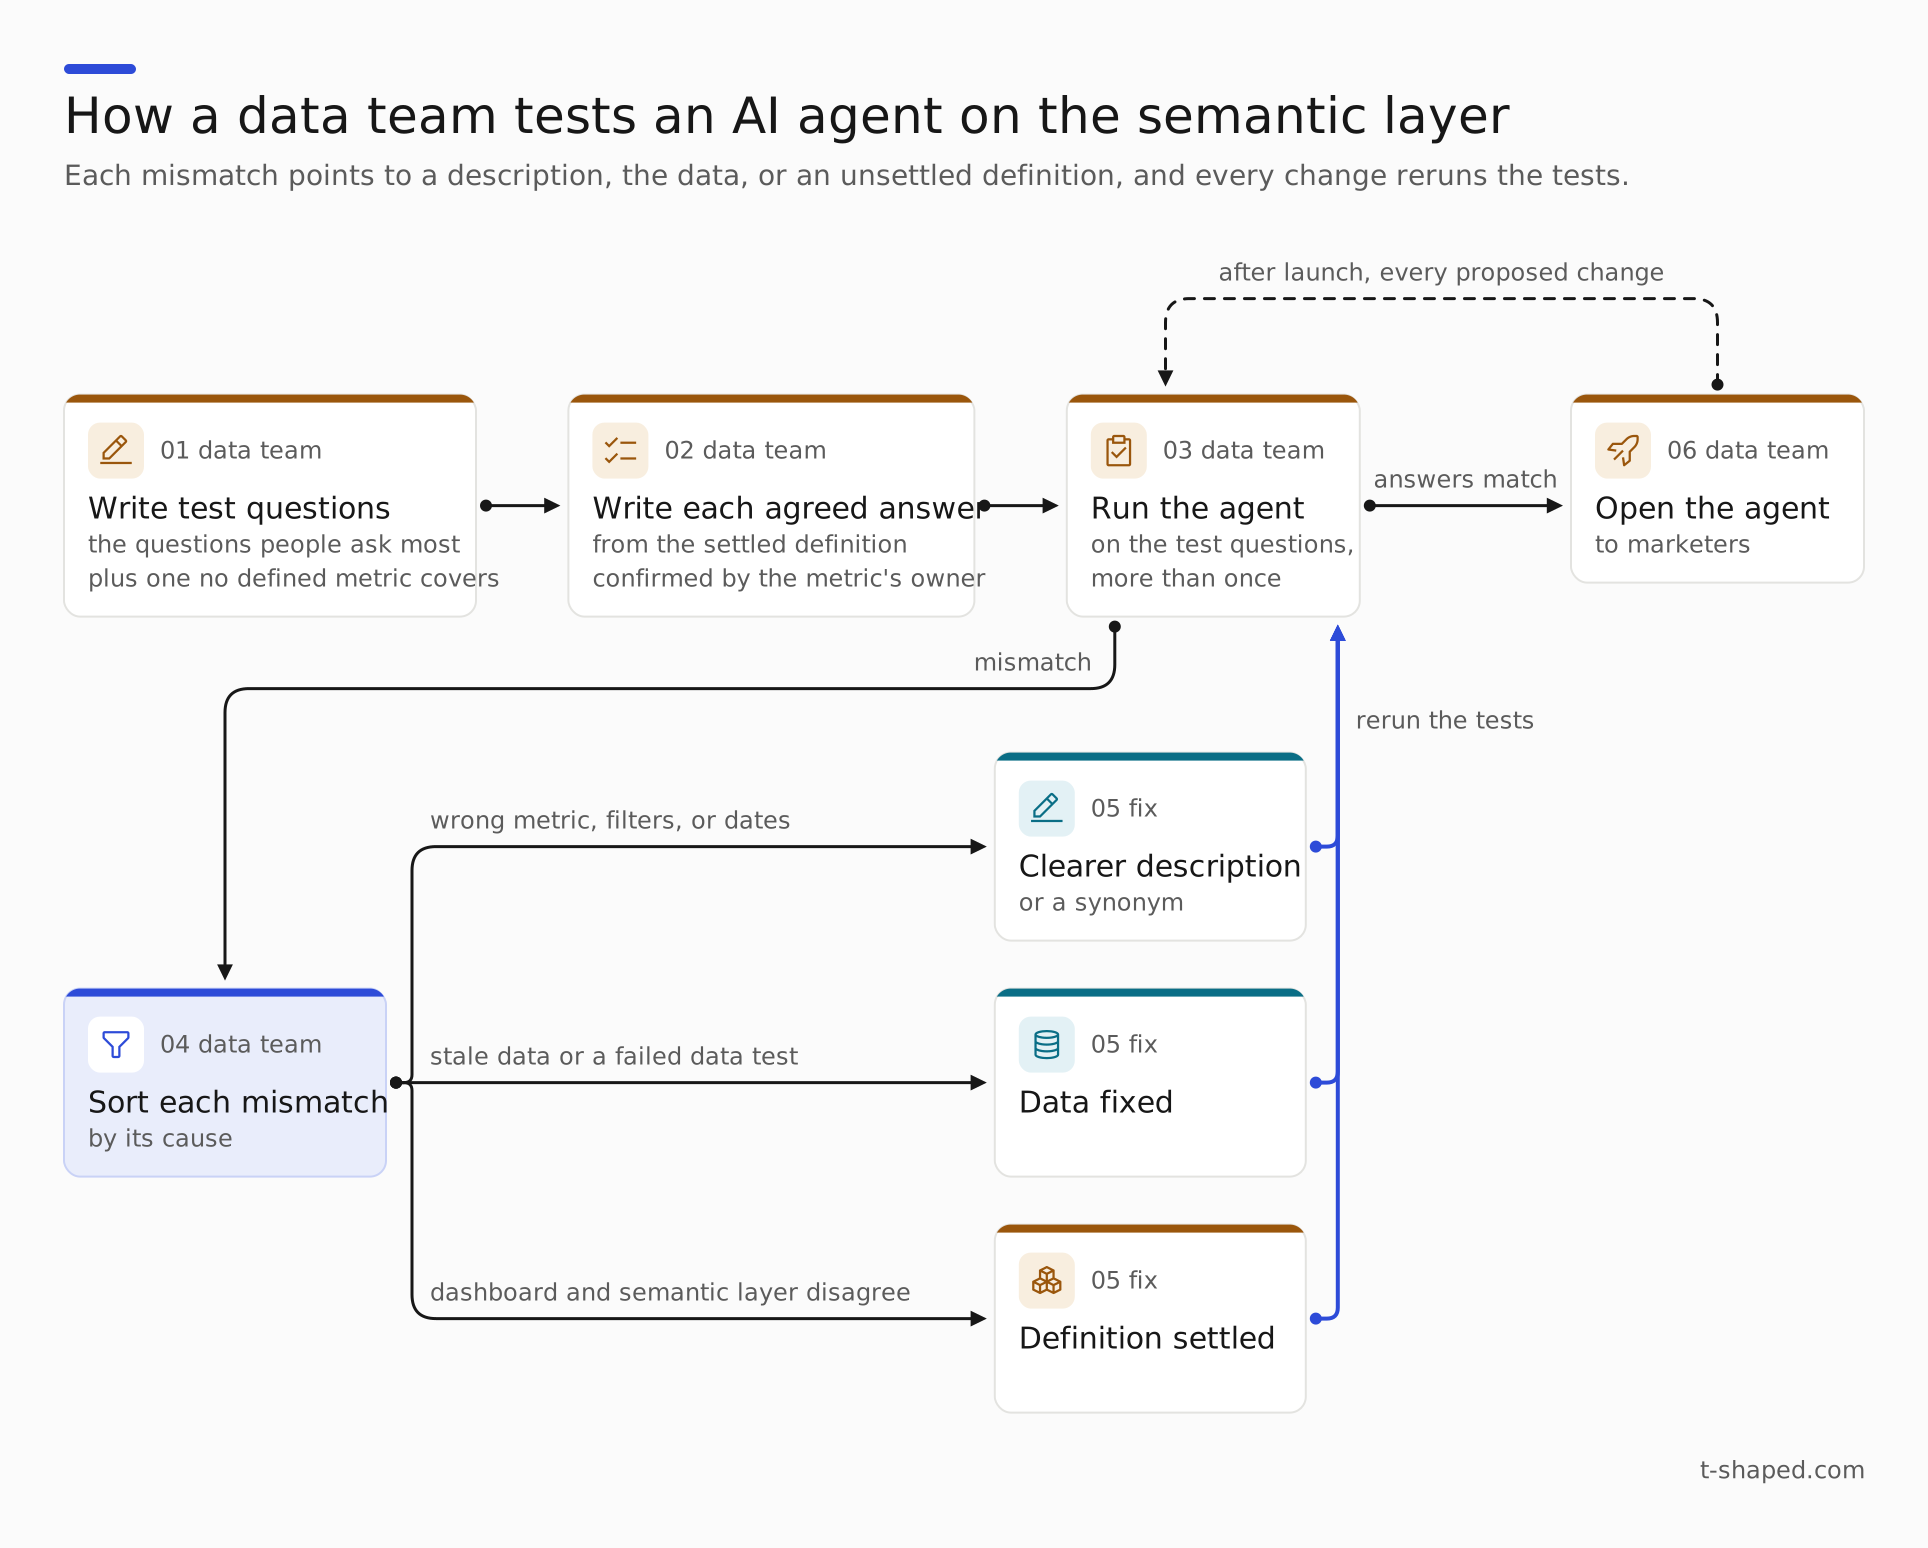
Write test questions. I'd start with maybe twenty of the questions people ask most, and keep the set. Include one question no defined metric covers. It passes only if the agent replies that no defined metric covers it.
-
Write each agreed answer. The data team computes it from the settled definition, and the metric's owner confirms it. Where finance has its own number, such as revenue as booked, add it as a named version with finance's figure as its agreed answer.
-
Run the agent on them, more than once. Databricks lets a team attach the correct SQL to each test question and compares the agent's result with it. It also suggests two to four wordings per question.
-
Sort each mismatch by its cause, and fix the description, the data, or the definition it points to.
-
Open the agent to marketers once its answers match the agreed numbers on the test questions.
Data tests run each time the pipelines bring in new data. When a test has failed, the agent should say the number is on hold, which it can do only if its connector shows it the test results.
Rerun the tests on every change, so nothing that worked breaks
Each addition to the data model can break a metric already defined or a dashboard that reads from it. My advice is to run the test questions and the data tests automatically on every proposed change to the data model's code, such as a pull request, so a change that breaks a number never ships.
Snowflake's guide to evaluating its agents recommends running the set on every configuration change and on a schedule. Scheduled runs catch problems from language model updates, data changes, or tool settings that drift. The guide also says to pin a specific language model for the agent rather than take the automatic setting.
Download: SVG, PNG. Wider than the screen: swipe sideways, or download the PNG.
A brand can test whether its data is AI-ready
The phrase AI-ready data works best as a test. A brand's data passes for an agent when:
- each first metric has one written definition and an owner
- the tables under each metric pass their data tests, with lineage back to the source system
- tables and columns carry plain descriptions
- on the test questions, the agent gives the agreed numbers
Grow the semantic layer from the questions people keep asking
After launch, a log of what marketers ask the agent shows which questions to turn into defined metrics, and what each addition costs to keep fresh.
Flagged answers become fixes, and repeated questions become metrics
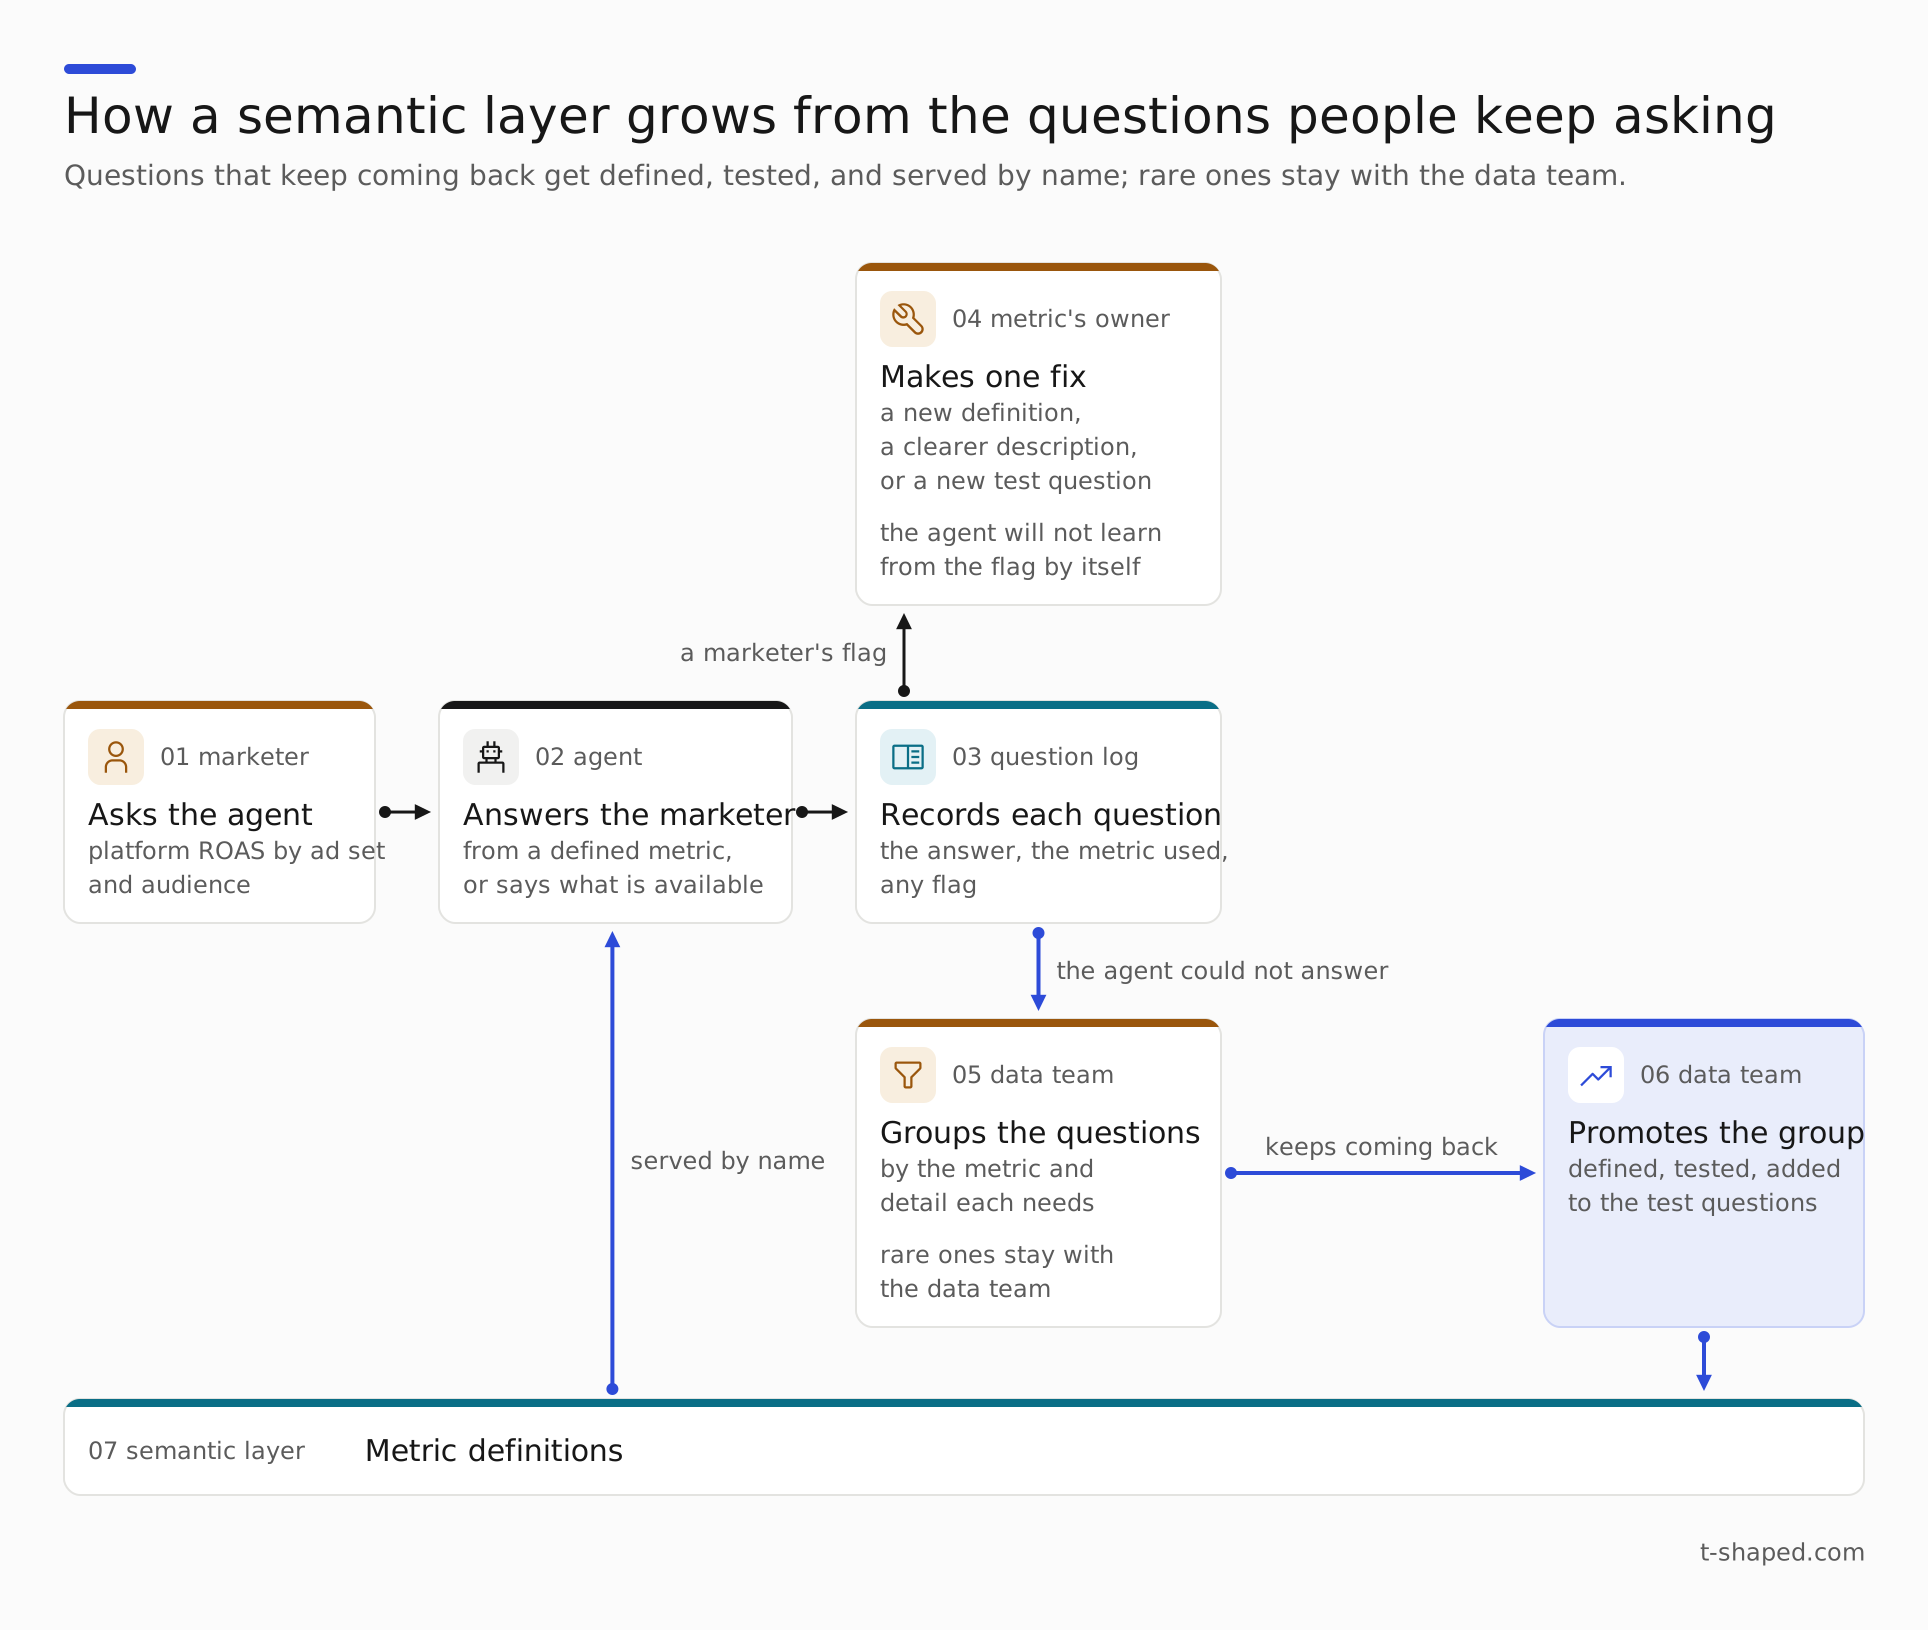
The data team keeps a question log: each question marketers ask the agent, the answer, the metric used, and any flag. The AI tool's records and the connector's record supply it. A marketer's flag goes to the metric's owner. Don't expect the agent to learn from the flag: Databricks says its agent's behavior does not change based on user feedback alone. The owner's fix is a new definition, a clearer description, or a new test question.
The data team groups the questions the agent could not answer by the metric and detail each needs. It adds the ones that keep coming back and answers a rare one by hand. In the example brand, requests for platform ROAS by ad set and audience keep arriving, so the data team adds ad set and audience as ways to split platform ROAS.
Download: SVG, PNG, MP4. Wider than the screen: swipe sideways, or download the PNG.
Precompute the answers people ask for often
Once a question comes up often, especially at a fine grain, store its answer ahead of time in the transformation step or the BI tool. A precomputed answer returns faster. I recommend refreshing it on a schedule to keep it fresh and easy for downstream tools to pull. Databricks gives the same advice for its metric views: precompute the combinations queried often, knowing each refresh incurs pipeline charges.
Questions this piece answers
What is a semantic layer?
A semantic layer is a set of metric definitions, written in code, that sits between the data model and every tool that shows a number. A dashboard or an agent asks for a metric by name, and the layer finds the path between the tables from the declared keys, writes the SQL, and returns the number with the definition used.
What is a marketing data model?
A marketing data model is the governed tables the data team reshapes from raw data, then tests, documents, and owns, such as ad spend and orders. Each table has a grain, what exactly one row stands for, and a join matches two tables on a key they share.
Why doesn't my AI agent's revenue match the dashboard?
Your store, ad platforms, and site analytics each calculate revenue differently, and some see only part of the sales. Ask an agent for revenue with no definitions in place and it picks one, and you won't know which.
Should an AI agent get direct SQL access to our data warehouse?
Marketers' agents should get the defined metrics and no raw SQL connection, with no tool that lets the agent write and run its own SQL against the tables.
Which metrics should we define first in a semantic layer?
Prioritize the metrics where two teams quote two different numbers; revenue is the most common. Attributed customer counts come next, such as new customers by channel and the customer acquisition cost (CAC) built on them.
How do I know if our marketing data is AI-ready?
A brand's data passes for an agent when each first metric has one written definition and an owner, the tables under each metric pass their data tests with lineage back to the source system, and tables and columns carry plain descriptions. On the test questions, the agent gives the agreed numbers.
Sources
- 1 sales https://shopify.dev/docs/api/shopifyql/latest/schemas/sales_revenue/sales
- 2 Understanding symmetric aggregates https://docs.cloud.google.com/looker/docs/best-practices/understanding-symmetric-aggregates
- 3 Curate an effective Genie Agent https://docs.databricks.com/aws/en/genie-agents/best-practices
- 4 Analytics dimensions and metrics https://support.google.com/analytics/table/13948007?hl=en
- 5 Review Conversion insights https://help.pinterest.com/en/business/article/conversion-insights
- 6 Understand your conversion tracking data https://support.google.com/google-ads/answer/6270625?hl=en
- 7 Spider 2.0: Evaluating Language Models on Real-World Enterprise Text-to-SQL Workflows https://arxiv.org/html/2411.07763v2
- 8 Spider 2.0: Evaluating Language Models on Real-World Enterprise Text-to-SQL Workflows (leaderboard) https://spider2-sql.github.io/
- 9 EntSQL: A Benchmark for Grounding Text-to-SQL in Long-Context Enterprise Knowledge https://arxiv.org/html/2606.03363v3
- 10 Algorithm Aversion: People Erroneously Avoid Algorithms After Seeing Them Err, Journal of Experimental Psychology: General (American Psychological Association) https://faculty.wharton.upenn.edu/wp-content/uploads/2016/11/20-Dietvorst-Simmons-Massey-2015.pdf
- 11 Cache common queries https://docs.getdbt.com/docs/use-dbt-semantic-layer/sl-cache
- 12 Snowflake-managed MCP server https://docs.snowflake.com/en/user-guide/snowflake-cortex/cortex-agents-mcp
- 13 Power BI MCP servers overview https://learn.microsoft.com/en-us/power-bi/developer/mcp/mcp-servers-overview
- 14 dbt Semantic Layer https://docs.getdbt.com/docs/use-dbt-semantic-layer/dbt-sl
- 15 How to Build a Golden-Question Benchmark for Your Data Agents https://datalakehousehub.com/blog/data-agent-golden-question-benchmark/
Notes on confidence
Every claim above was checked against its cited source on . In all, 137 more sources in the research file were read for context and not cited:
- 2025 State of Analytics Engineering Report, dbt Labs
- New dbt Labs Report Finds AI-driven Acceleration is Outpacing Trust and Governance, dbt Labs
- Only 6% of Marketers Have Fully Implemented AI, According to New Supermetrics Report, Supermetrics (PR Newswire release, Kyodo News PR Wire copy)
- How we structure our dbt projects, dbt Labs (dbt Developer Hub)
- Facebook Ads connector, Fivetran (documentation)
- [GA4] BigQuery Export, Google (Analytics Help)
- What is analytics engineering?, dbt Labs
- Dimensional Modeling Techniques, Kimball Group
- Four-Step Dimensional Design Process, Kimball Group
- Grain, Kimball Group
- Fact Table Structure, Kimball Group
- Additive, Semi-Additive, and Non-Additive Facts, Kimball Group
- Why Do We Need Semantic Views? Avoiding Subtle Mistakes in Complex Calculations, Snowflake (engineering blog)
- Joins, dbt Labs (dbt documentation)
- Joins, Cube (Cube documentation)
- Add data tests to your DAG, dbt Labs (dbt documentation)
- dbt-utils, dbt Labs (GitHub repository README)
- About MetricFlow, dbt Labs (dbt Developer Hub)
- dbt Semantic Layer FAQs, dbt Labs (dbt Developer Hub)
- Available tools, dbt Labs (dbt Developer Hub)
- query_metrics tool prompt (dbt-mcp repository), dbt Labs (GitHub, dbt-labs/dbt-mcp)
- list_metrics tool prompt (dbt-mcp repository), dbt Labs (GitHub, dbt-labs/dbt-mcp)
- Set up remote MCP, dbt Labs (dbt Developer Hub)
- MCP server, Cube (Cube Documentation)
- Joins, Cube (Cube Documentation)
- Looker-managed MCP server, Google Cloud (Looker documentation)
- Introduction to LookML, Google Cloud (Looker documentation)
- US5555403A: Relational database access system using semantically dynamic objects, Google Patents (record of the US patent)
- dbt Labs Signs Definitive Agreement to Acquire Transform, Accelerating Development of the dbt Semantic Layer, dbt Labs (press release, PRNewswire)
- dbt Labs Affirms Commitment to Open Semantic Interchange by Open Sourcing MetricFlow, dbt Labs (press release)
- Can LLM Already Serve as A Database Interface? A BIg Bench for Large-Scale Database Grounded Text-to-SQLs, arXiv (NeurIPS 2023)
- BIRD-SQL: A Big Bench for Large-Scale Database Grounded Text-to-SQLs (leaderboard), BIRD team (University of Hong Kong and collaborators)
- BEAVER: An Enterprise Benchmark for Text-to-SQL, arXiv
- A Benchmark to Understand the Role of Knowledge Graphs on Large Language Model's Accuracy for Question Answering on Enterprise SQL Databases, arXiv
- Same Data, Different Schemas: Robustness of LLM-based Text-to-SQL, arXiv (aiDM '26 workshop, co-located with ACM SIGMOD 2026)
- GROUND: Reducing Hallucinations in LLM-Based Enterprise Analytics Through Governed Semantic Definitions, arXiv
- A Semantic-Layer-Mediated Agent for Natural Language to SQL over Heterogeneous Enterprise Databases, arXiv (submitted to FITAT 2026)
- Semantic Layer vs. Text-to-SQL: 2026 Benchmark Update, dbt Labs (dbt Developer Blog)
- Snowflake Cortex Analyst: Behind the Scenes, Snowflake (Engineering Blog)
- How Looker's semantic layer enables trusted AI for business intelligence, Google Cloud Blog
- Overcoming Algorithm Aversion: People Will Use Algorithms If They Can (Even Slightly) Modify Them, The Wharton School, University of Pennsylvania (working paper copy)
- Trust Formation, Error Impact, and Repair in Human-AI Financial Advisory: A Dynamic Behavioral Analysis, Behavioral Sciences (MDPI), via PubMed Central
- Lack of AI-Ready Data Puts AI Projects at Risk, Gartner
- Gartner 2026 CMO Spend Survey Finds CMOs Allocate 15.3% of Marketing Budgets to AI, But Only 30% Are Ready to Scale AI Capabilities, Gartner
- 2026 State of Data Integrity and AI Readiness, Drexel University LeBow College of Business, Center for Applied AI and Business Analytics, with Precisely
- AI errors reach boardrooms and investors, midyear report finds, Thomson Reuters Checkpoint News
- Data Study: 84% of Technical Leaders Need Data Overhaul for AI Strategies to Succeed, Salesforce
- Only 7% of Enterprises Say Their Data Is Completely Ready for AI, According to New Report from Cloudera and Harvard Business Review Analytic Services, Cloudera
- Data Quality: Best Practices for Accurate Insights, Gartner
- Inside OpenAI's in-house data agent, OpenAI (Engineering)
- Troubleshoot Genie Agents, Databricks (documentation)
- Cortex Analyst, Snowflake (documentation)
- Semantic View Autopilot, Snowflake (documentation)
- Guide agent behavior with authored context, Google Cloud (documentation)
- Threads, Hex (documentation)
- Can AI Agents Answer Your Data Questions? A Benchmark for Data Agents, arXiv (UC Berkeley, University of Washington, Hasura PromptQL)
- Semantic Layers Are a Patch. Ontologies Are the Fix., TextQL (blog)
- Overview of semantic views, Snowflake
- Unity Catalog metric views, Databricks
- Databricks-provided MCPs, Databricks
- dbt Model Context Protocol server, dbt Labs
- Welcome to the agentic BI era with Looker, Google Cloud
- Query Datasource (Tableau MCP), Salesforce (Tableau)
- Introduction (Cube documentation), Cube
- Apache Ossie (Cube integration), Cube
- MCP Server Tools Reference, AtScale
- Apache Ossie (Incubating): The New Name for Open Semantic Interchange, Apache Ossie (incubating), The Apache Software Foundation
- Tags: apache/ossie, The Apache Software Foundation (GitHub)
- apache/ossie, The Apache Software Foundation (GitHub)
- Test and monitor a Genie Agent, Databricks
- Cortex Analyst evaluations, Snowflake
- Suggestions for semantic models and views, Snowflake
- YAML specification for semantic views, Snowflake
- Creating metrics, dbt Labs
- Refactor an existing rollup, dbt Labs
- Validations, dbt Labs
- Semantic Layer for AI and BI (2026): Why It Matters, How to Choose, and How to Implement It, Omni Analytics
- Semantic Layer for AI Agents (2026), Cube
- The Semantic Layer Series #4: Metric Definitions Need Owners, Antoine Buteau
- About conversion windows, Google (Google Ads Help)
- About data-driven attribution, Google (Google Ads Help)
- Recommended events, Google (Google Analytics developer documentation)
- Select attribution settings, Google (Analytics Help)
- Ads Insights API Metric Availability Updates, Meta (Meta for Developers blog)
- Ads reporting, Pinterest (Pinterest Developers)
- Attribution Metrics, TikTok (TikTok Business Help Centre)
- Fuel your TikTok campaign measurement with flexible attribution windows, TikTok (TikTok For Business blog)
- How to Create Attribution Windows for your Ad Group, TikTok (TikTok Business Help Centre)
- Revenue, Adobe (Experience League, Adobe Analytics Components Guide)
- Attribution components, Adobe (Experience League, Adobe Analytics Tools Guide)
- Understanding Klaviyo's predictive analytics, Klaviyo
- [GA4] Predictive metrics, Google
- 4-5-4 Calendar, National Retail Federation
- Calendar Date Dimensions, Kimball Group
- Header/Line Fact Tables, Kimball Group
- Fixed Depth Positional Hierarchies, Kimball Group
- Conformed Dimensions, Kimball Group
- Genie Ontology, Databricks
- What is ontology (preview)?, Microsoft
- Introducing the Knowledge Graph: things, not strings, Google
- Web Ontology Language (OWL), W3C
- Getting started with pre-aggregations, Cube
- Materialization for metric views, Databricks
- Proactive Steward Inbox, Actian
- First click, linear, time decay, and position-based attribution models are going away, Google (Google Ads Help announcement)
- customers (ShopifyQL schema reference), Shopify
- Churn Rate (Commerce Intelligence User Guide), Adobe
- Repeat Probability Decay and Churn (Commerce Intelligence User Guide), Adobe
- N-Day LTV in retention analysis, Amplitude
- RFM and CLV: Using Iso-value Curves for Customer Base Analysis, Bruce G. S. Hardie (author's site)
- Semantic models, dbt Labs
- Semantic Layer APIs, dbt Labs
- CREATE SEMANTIC VIEW, Snowflake
- Querying semantic views, Snowflake
- Open SQL Interface, Google Cloud (Looker)
- Curating datasets with topics, Omni
- AI MCP Server, Omni
- Modeling in Omni, Omni
- Best Practices for Evaluating Cortex Agents, Snowflake (Snowflake for Developers guides)
- Cortex Agent evaluations, Snowflake Documentation
- Evaluation best practices, OpenAI (API documentation)
- Define success criteria and build evaluations, Anthropic (Claude Platform documentation)
- Model IDs and versioning, Anthropic (Claude Platform documentation)
- Building trust in AI agents: A production-ready evaluation framework with Amazon Bedrock AgentCore, AWS Machine Learning Blog
- Getting started with data lineage, dbt Labs (blog)
- Discover data with Catalog, dbt Labs (dbt Developer Hub)
- About OpenLineage, OpenLineage (LF AI & Data project documentation)
- Is the "Modern Data Stack" Still a Useful Idea?, The Analytics Engineering Roundup (dbt Labs newsletter)
- The problem was the product, benn.substack
- Fivetran and dbt Labs Unite to Set the Standard for Open Data Infrastructure, dbt Labs (press release)
- See how Domo turns your data into smarter decisions, Domo (product page)
- Prep and transform your data for AI, fast, Domo (product page)
- Why the Domo Acquisition Made Sense for Progress, Progress Software (company blog)
- Dynamic tables, Snowflake (documentation)
- Dataform overview, Google Cloud (documentation)
- Spark Declarative Pipelines on Lakeflow, Databricks (documentation)
- What is a data lakehouse?, Databricks (documentation)
Changes since publication
Researched and drafted with AI assistance. Reviewed, edited, and approved by Scott Zakrajsek. Every claim is checked against its source. How the articles are made.